


Modern trading on cryptocurrency markets is less and less like an intuitive game and more and more a matter of precise data analysis. The struggle for profit has to be fought for in an environment of high volatility, information noise and competition with algorithmic systems. In such an environment, the advantage goes to those who rely not on guesswork, but on real market flow: transaction volumes, limit orders, buy and sell delta.
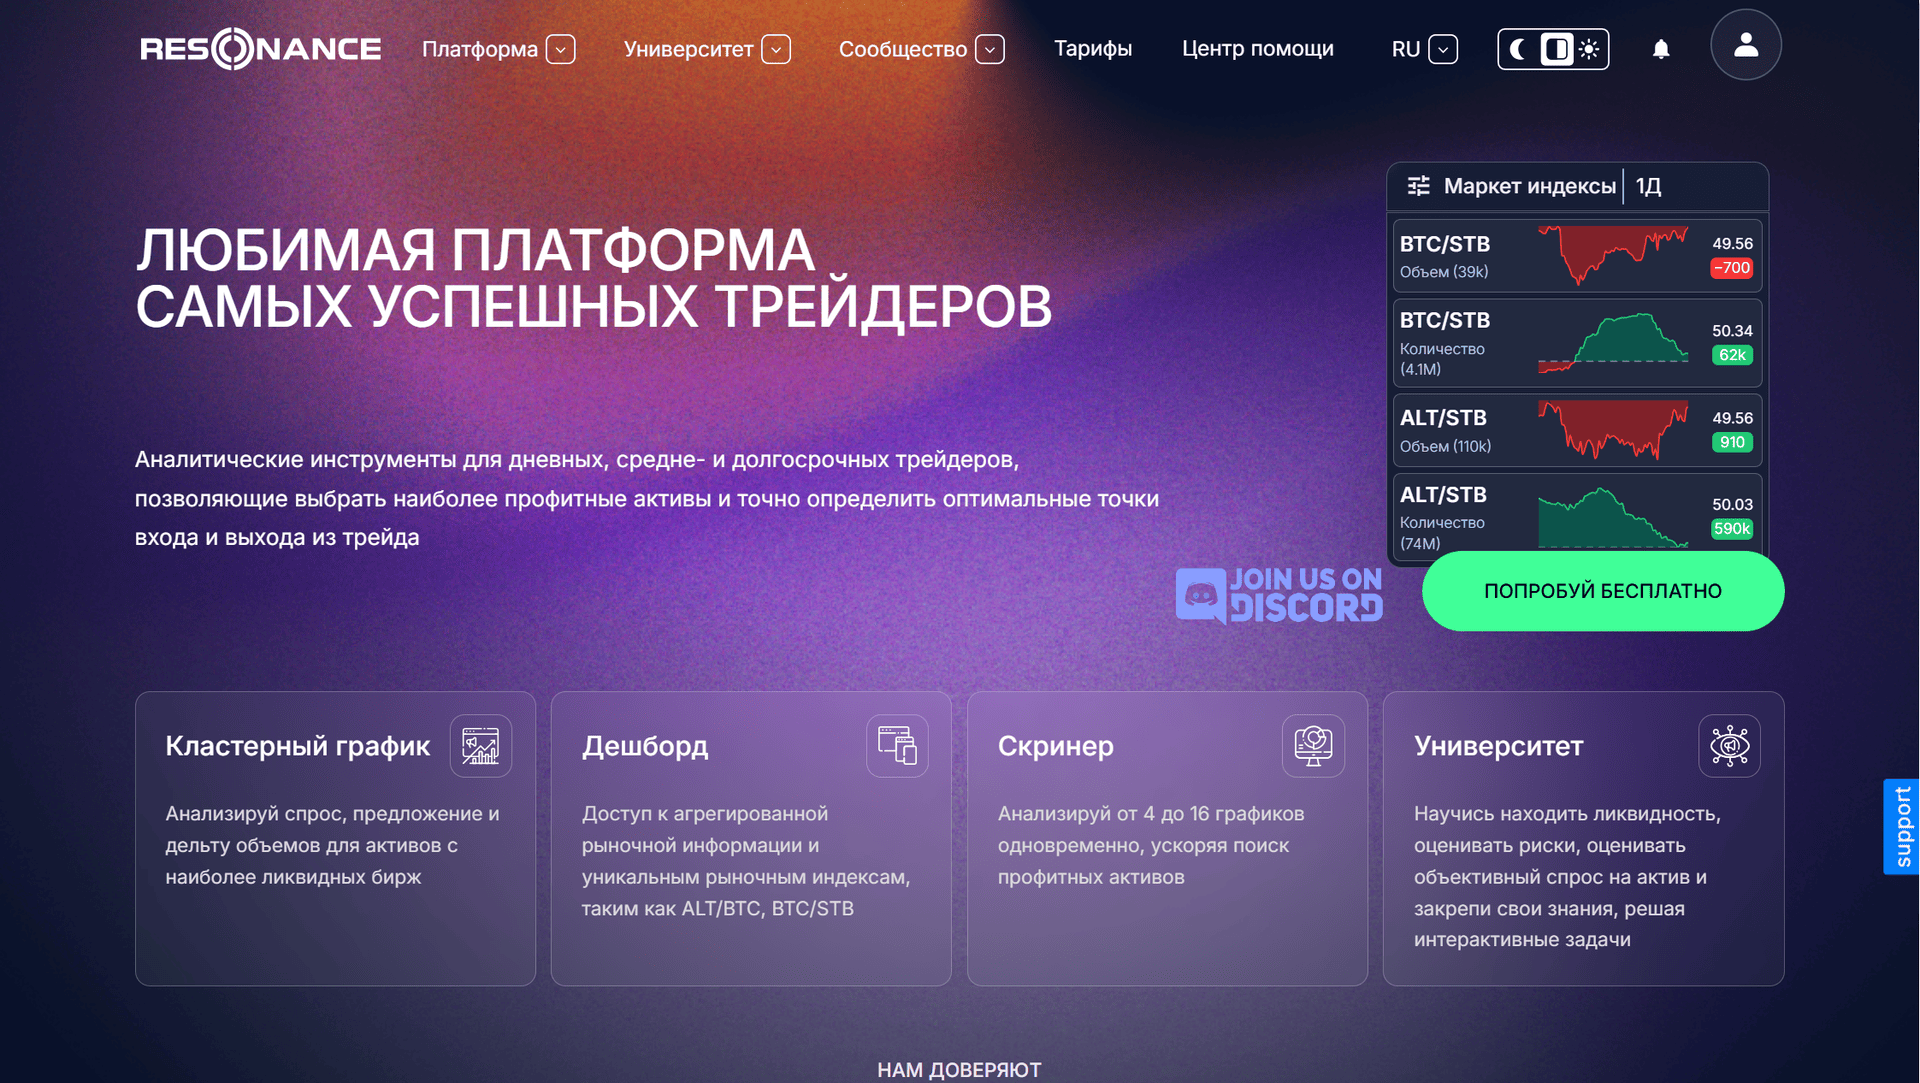
This means that traders need not just access to data, but full-fledged analytical systems capable of identifying patterns and signals before others. Resonance.Vision positions itself as just such a platform – an “analytical combine” for traders and investors in digital assets. But what’s behind the stylish interface and clever marketing? Is it really a new nugget for traders or just another passable and unscrupulous something? Below is a detailed and unbiased analysis of the functionality, educational base and business model of the Resonance Vision platform.
Resonance.Vision is a multifunctional online platform for real-time analysis of cryptocurrency markets. Its main advantage is its integrated approach (combining market analytics, learning and algorithmic thinking in one interface).
Resonance.Vision platform appeared in 2024 as an independent project developed by a team of Ukrainian traders and programmers specializing in cryptocurrency markets. Initially, the service was created as a highly specialized cluster analysis tool for the team’s own needs. However, with the growing interest in algorithmic trading and volumetric analytics, the developers decided to make the platform publicly available.
The first public version was introduced in November 2024 – with basic functionality: cluster chart, screener and tutorials. Thanks to the quick response of the community and feedback from users, a number of improvements were launched in the first months: new exchanges, customization of alerts, multi-disciplinary dashboards, and a simulator of large players’ behavior were added.
In 2025, the platform began to actively expand, paid mentoring programs, integration with Telegram, and a system of trading signals based on delta and liquidity were launched. An important milestone was the introduction of a tariff model with a trial period, which made it possible to attract users without initial costs.
Today, Resonance.Vision is actively developing as an analytical and educational ecosystem for crypto traders – with a focus on independence, speed and depth of analysis. Despite the lack of licenses and official registration (which may be coming soon), the platform has gained a stable core of loyal users and continues to introduce new features in response to market trends.
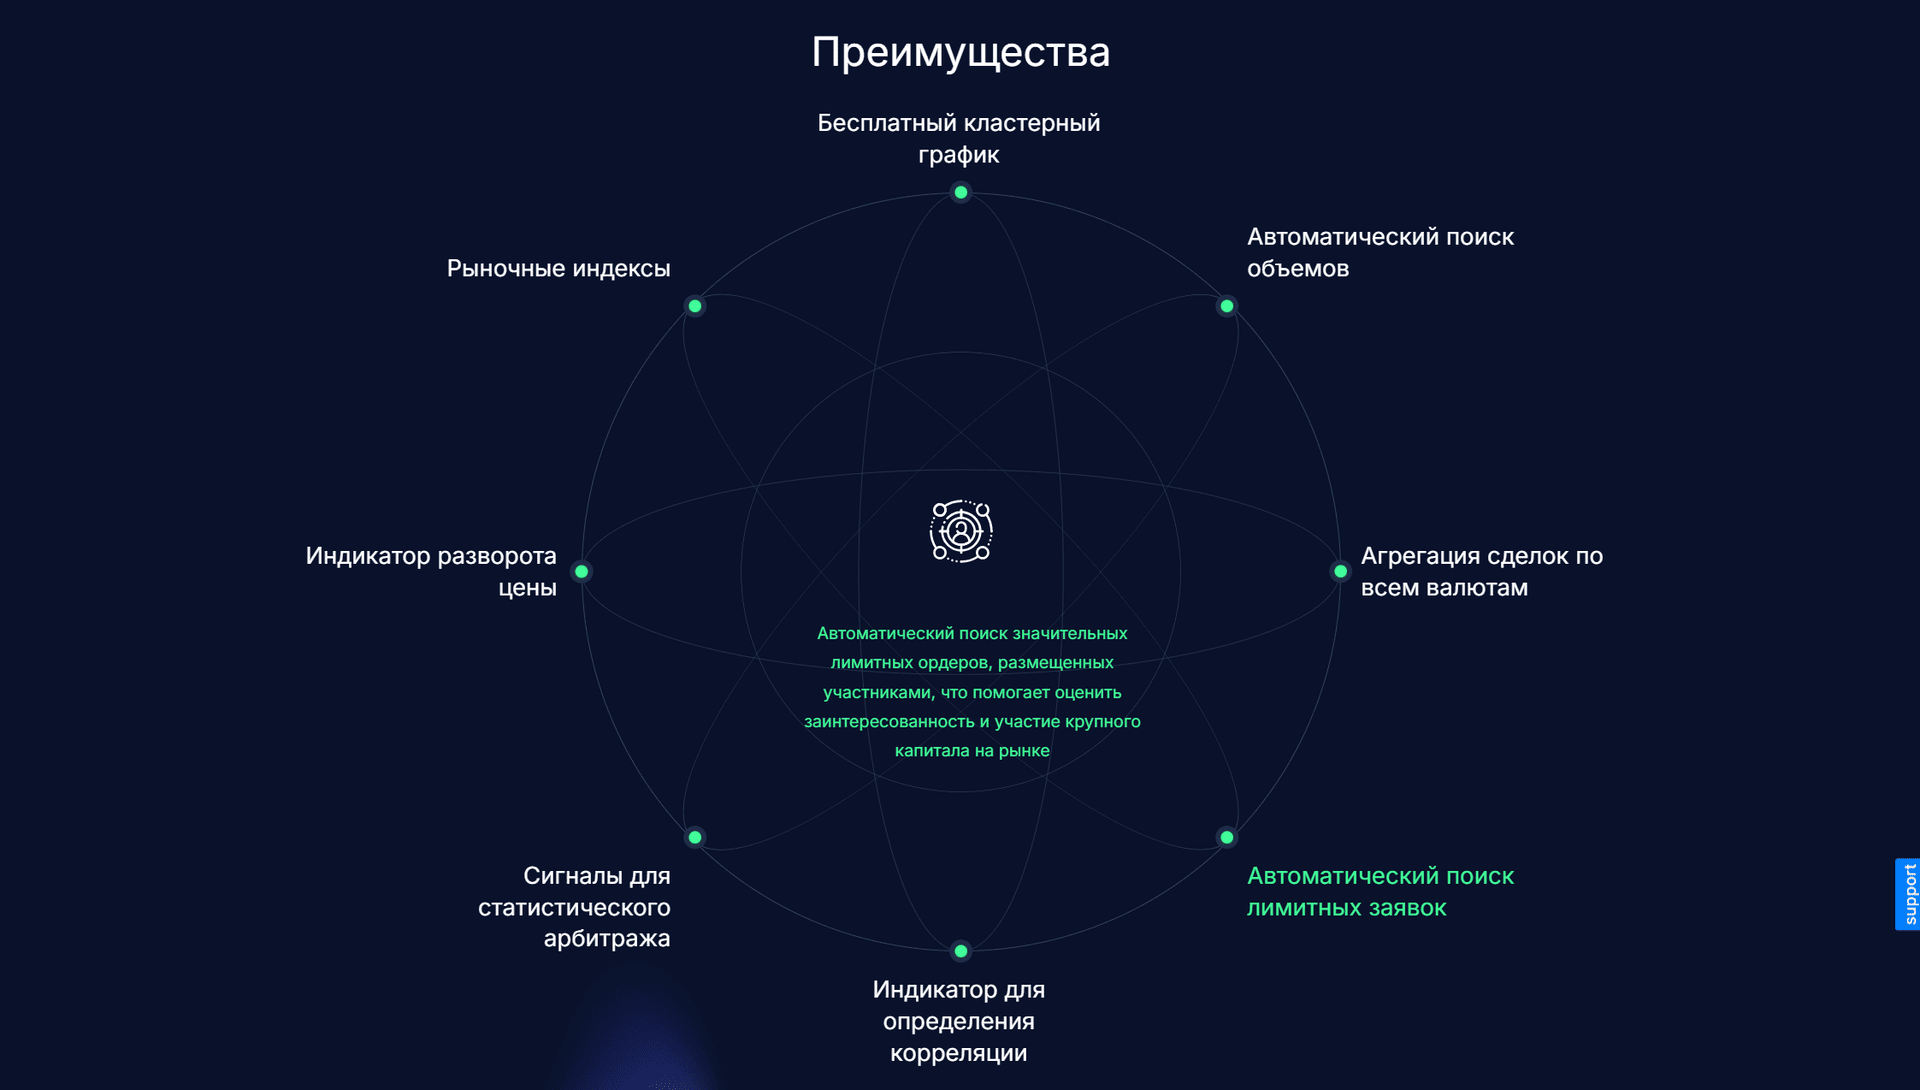
Resonance.Vision offers a powerful set of tools for technical and behavioral analysis of the crypto market. The platform is aimed at professional traders and analysts who value accuracy of signals, depth of market data and flexibility of the interface. Here are the key features of the platform that are worth knowing…
This is a cluster chart that aggregates data from dozens of exchanges (Binance, Bybit, OKX, Bitget, etc.) in real time. Users can see not only price, but also volumes, delta (difference between buys and sells), liquidations, clusters and large orders. The chart is customizable for the tasks of a particular trader: filters by time, exchanges, assets, data types. Key features: customizable time intervals, highlighting of large orders, heat map of volumes and delta, comparison of several trading pairs. This tool will be very useful for experienced traders who analyze the flow of orders and the behavior of “whales”.
Instantly tracks coins that match the specified conditions. This saves time and helps you not to miss trading signals. Allows you to simultaneously track dozens of coins according to specified criteria. You can customize filtering by volume, sharp delta changes, liquidation spikes and other signals. The interface is minimalistic but intuitive. Plus, there are sound and visual alerts, which is critical for those who do not sit in charts 24/7.
Two types of screener are available on the platform: the basic screener (available on all tariffs) and the FTT screener (available only on extended subscriptions).
Basic Screener, Basic Screener is a tool for quick assessment of market activity, combining filters, visualization and navigation between tickers. It is particularly useful for monitoring the market situation in real time.
Main components:
FTT Screener, FTT Screener is an advanced version of the screener that uses the FTT (Flow Trade Tracker) algorithm to find potential entry points based on cluster accumulations. It is designed for deeper analysis and is used by experienced traders.
Works on the same interface as Basic, but adds visual labels on the charts (red and green vertical lines). In addition, the FTT Legend on the chart shows on which data types (volume, delta, liquidation) the activity was recorded. For each ticker, the history of FTT signals is displayed, and in parentheses is information in which types of clustered data accumulation was found. This screener is especially useful for finding entry and exit points when large players enter the market and form the structure of price movement.
The screener in Resonance.Vision is not just a list of assets. It is a full-fledged analytical tool capable of highlighting in real time what eludes classical indicators. And with FTT access, it turns into a powerful weapon for evaluating local market extremes.
The Resonance.Vision dashboard is the main analytical center of the platform, where key market data in the form of charts, tables, indices and diagrams are collected in one window. Modules of choice can be brought out here. It is a space where a trader can quickly assess the situation across multiple tickers without switching between instruments.
Main components:
The panel allows you to customize display, timeframe synchronization and data aggregation type. There are limits on the number of simultaneously opened charts and indexes, so as not to overload the interface. If the limit is exceeded, the system will offer to close some blocks.
Main components:
Indexes – displays aggregated data by asset group (BTC, ALT, STB, FIAT), combining tickers from all exchanges.
Currencies – grouped by coin, shows full market activity for the coin as a whole.
Tickers – data for each pair on a particular exchange (e.g. ETH/USDT on Binance).
Filters – flexible customization of display (volume, delta, Z-coefficient, price change, etc.).
Charts – visualization of metrics (delta, balance, Z-coefficient, price). There are comparisons between tickers and cross rates construction.
Tables – display all data in the form of tables with the ability to filter, sort and analyze.
Market Delta allows a trader to work not with individual coins, but with behavioral patterns of entire groups of assets. It is ideal for evaluating the strength of the trend, the mood of participants and identifying market distortions. It is especially useful for comparative analysis.
BAS (Bid Ask Sum) is Resonance.Vision’s analytical tool for evaluating limit order side activity. It is available through RTT chart settings and helps to track how total buy and sell orders change.
The ABC consists of two main parts: graphs and tables. Graphs show the dynamics of such indicators as the sum of bid and ask, their delta, balance between the parties, Z-coefficient and zonal changes in volumes. The display format is customizable; line graphs allow you to see pure dynamics, while multi-zonal graphs help you quickly assess areas of increased activity.
The BAS table aggregates data by tickers and exchanges. It can be filtered by basic metrics: trading volume, bid-ask delta, order balance, Z-coefficient on volume, and price change over the period. This makes it easier to find anomalies and assets with sudden changes in buyer or seller interest.
The tool also allows you to work with aggregation. You can analyze data separately by tickers or group them by indices. At the same time, timeframe and percentage range settings from the best price are available, which allows you to filter market changes more accurately.
BAS is especially useful for those traders who want to see the hidden actions of major participants before they appear on the price chart. Active growth of bid or sharp fall of ask often signal a possible change of price direction long before its real movement.
Notes in Resonance.Vision is a tool for capturing trade ideas, tickers and comments with the ability to later analyze their effectiveness. Each note saves important parameters: ticker, exchange, price and trade direction (long, short or watch).
The notes panel displays graphs: a pie chart shows the distribution of ideas by direction or success (PnL), and a bar histogram shows cumulative gains and losses. In the table, you can filter notes by exchanges, tags, tickers, and index groups. Each entry opens with detailed information: chart at the time of creation, entry price, implied stop loss or take profit.
It is possible to create notes both from RTT chart and from the screener – all parameters are substituted automatically, which speeds up the process of fixing ideas.
The Resonance.Vision platform offers a flexible subscription system designed for traders with different levels of training and requests for functionality. From free access to get acquainted with basic features to advanced tariffs with advanced analytics and deep data history – each user can choose the best option for his/her purposes. do not forget that by registering on the site using our referral link https://resonance.vision/ua/auth/registration?ref=09098748e7644b949532a5223f02e3bf you get a huge advantage – 11.25% cashback on the purchase of any services on the site. Below is a brief overview of all available tariff plans and their key features.
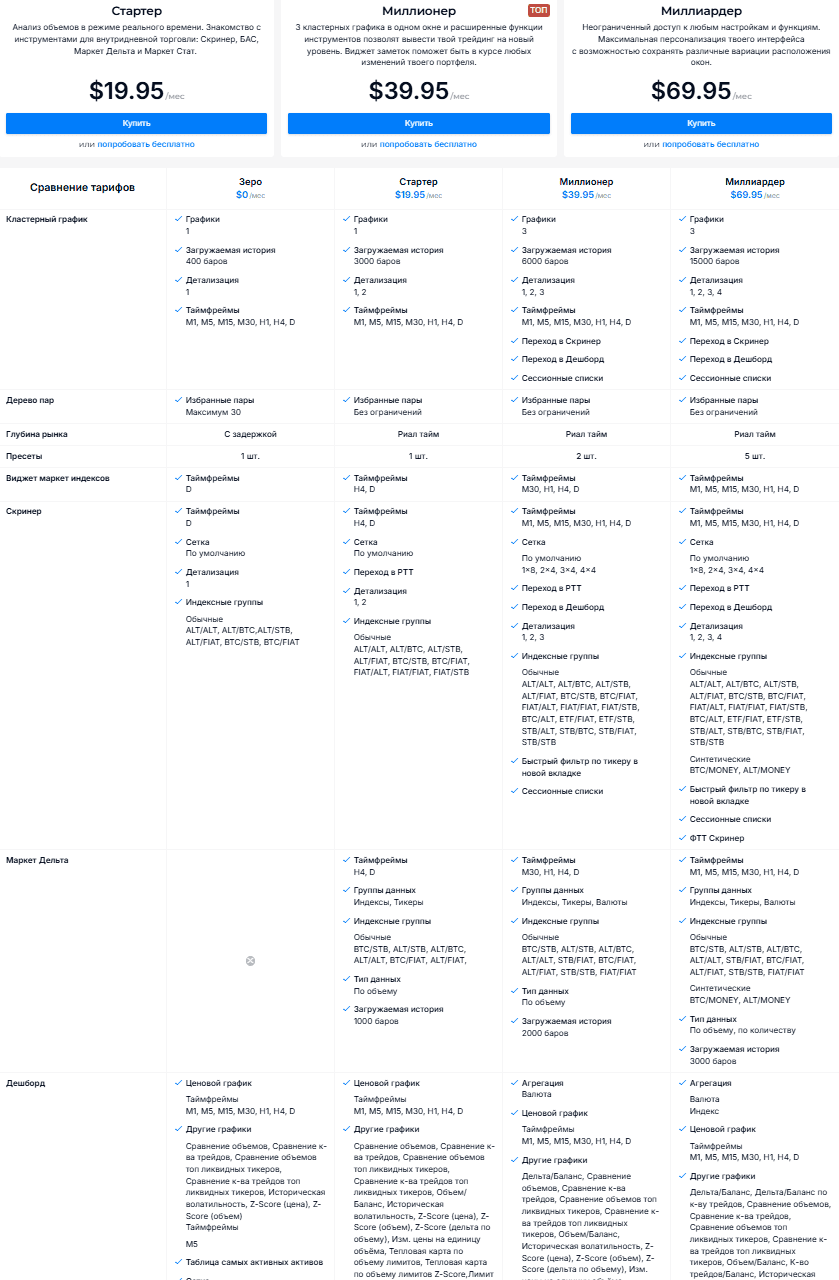
Zero – $0 per month. Free tariff for familiarization with the platform. Basic functionality is available: one cluster chart with history limitation (up to 400 bars), basic screener and dashboard. Market depth is available with a delay, pair tree is limited to 30 selected assets.
Starter – $19.95 per month. Suitable for active intraday analysis. Opens access to real time for individual functions, expands the screener and dashboard settings, allows you to work with one RTT instrument without limitation on the number of tickers. Provides access to Market Delta and ABC.
Millionaire – $39.95 per month. Advanced version with the ability to work with three charts in one window, access to extended index groups, session lists and full real-time support.
Billionaire – $69.95 per month. Maximum tariff for those who need customization of all modules, work with data aggregation, deep chart history (up to 3000 bars) and full control over the settings of the Dashboard and Market Delta.
Please note that if you pay for a year, the administration provides a 25% discount on all tariffs. In addition, a free trial period (7 days) is provided for all paid tariffs.
In addition to the basic tariffs, separate subscriptions for signaling packages are available on the platform.
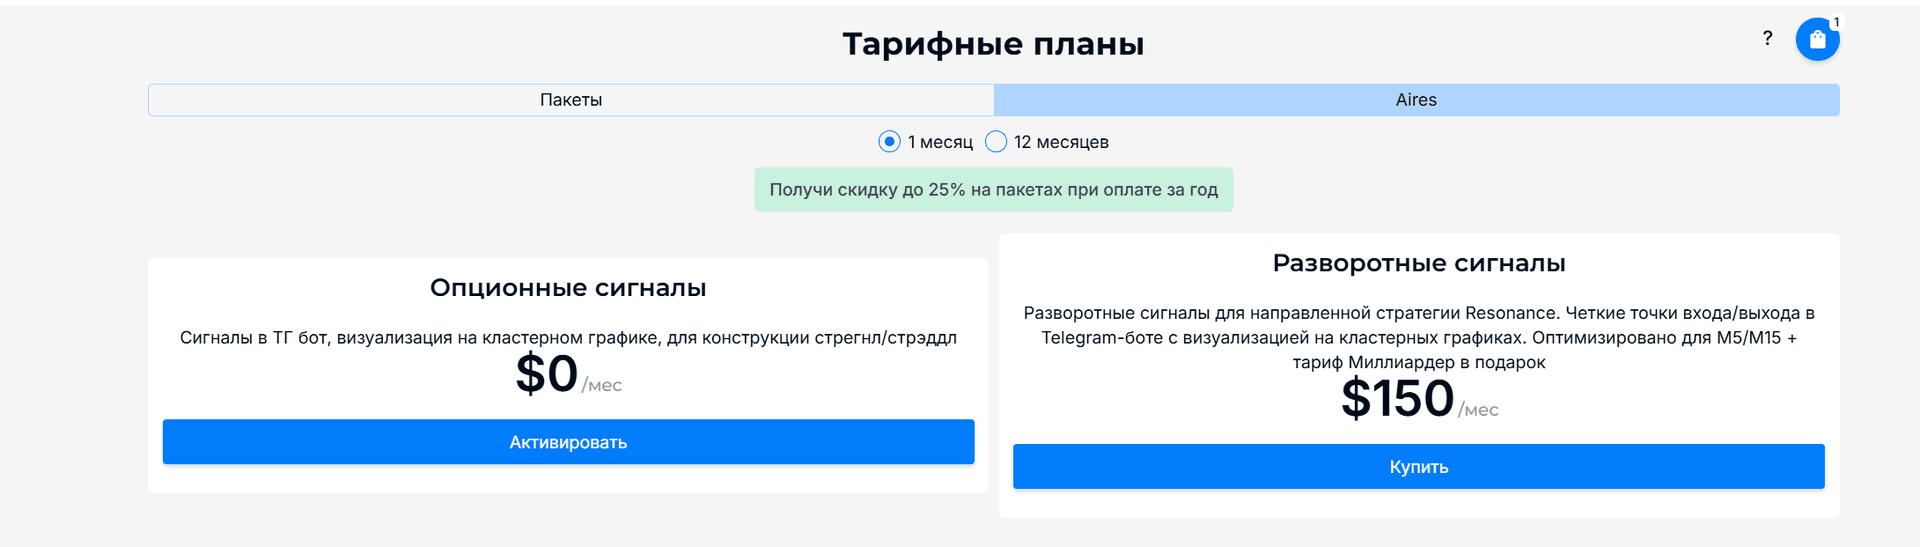
Option Signals – a free package including notifications via Telegram-bot with visualization on cluster charts. It is designed to help you build option strategies of strangle and paddle types.
Reversal Signals is a paid package ($150 per month) that provides clear entry and exit points for Resonance directional strategies. Optimized for M5 and M15 timeframes. The “Billionaire” tariff with all the features of the platform is included as a gift.
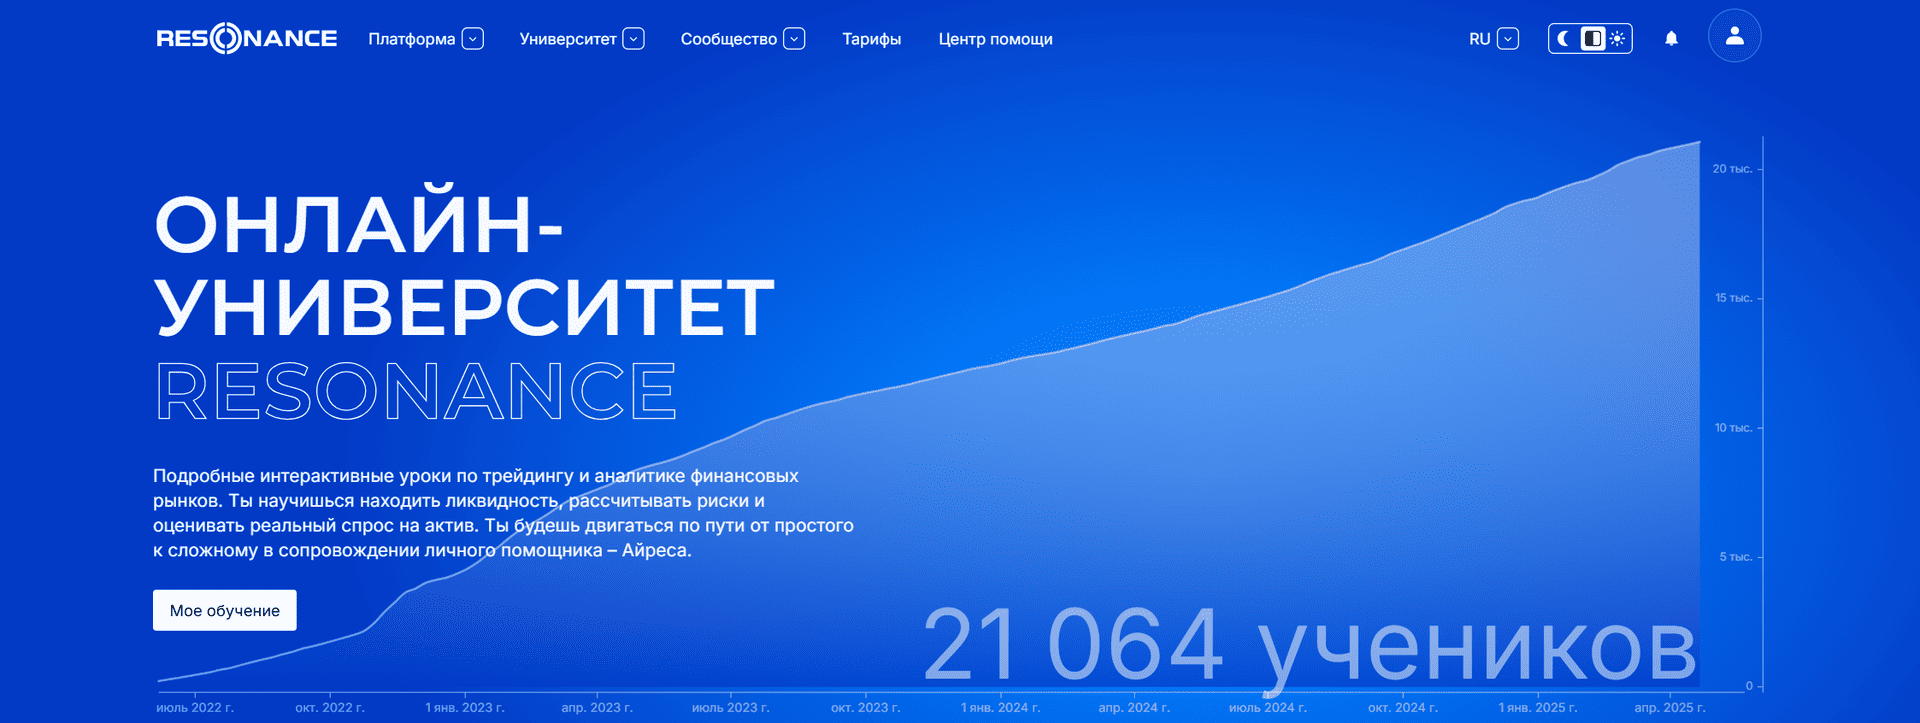
The educational part of Resonance.Vision is built as a complete training system for traders seeking to work with cluster analysis, order flows and a deep understanding of market mechanics. The training is divided into free and paid modules.
The free block includes basic courses on the fundamentals of market volumes, delta, liquidity, and working with the platform tools. Tests, a major player simulator and a glossary of terms are available. The materials are adapted for self-study and provide insight into the principles of market behavior that are usually missed in classical technical analysis.
Paid programs focus on more in-depth training. They cover practical trading strategies based on volume and accumulation, arbitrage approaches, and working with options. Mentoring programs offer individual strategy development with a mentor.
The training format combines theory, practical tasks and work with real charts in the Resonance.Vision interface, which helps to transfer knowledge into trading practice faster. The platform also holds regular intensives, deal breakdowns and online sessions for its users.
According to the administration, the educational section of Resonance.Vision is useful both for beginners who want to understand the market from the inside, and for experienced traders seeking to improve their analysis and optimize their trading decisions. But since the company is quite young, we cannot guarantee the effectiveness of their courses and mentors. But time will put everything in its place and show who is who….
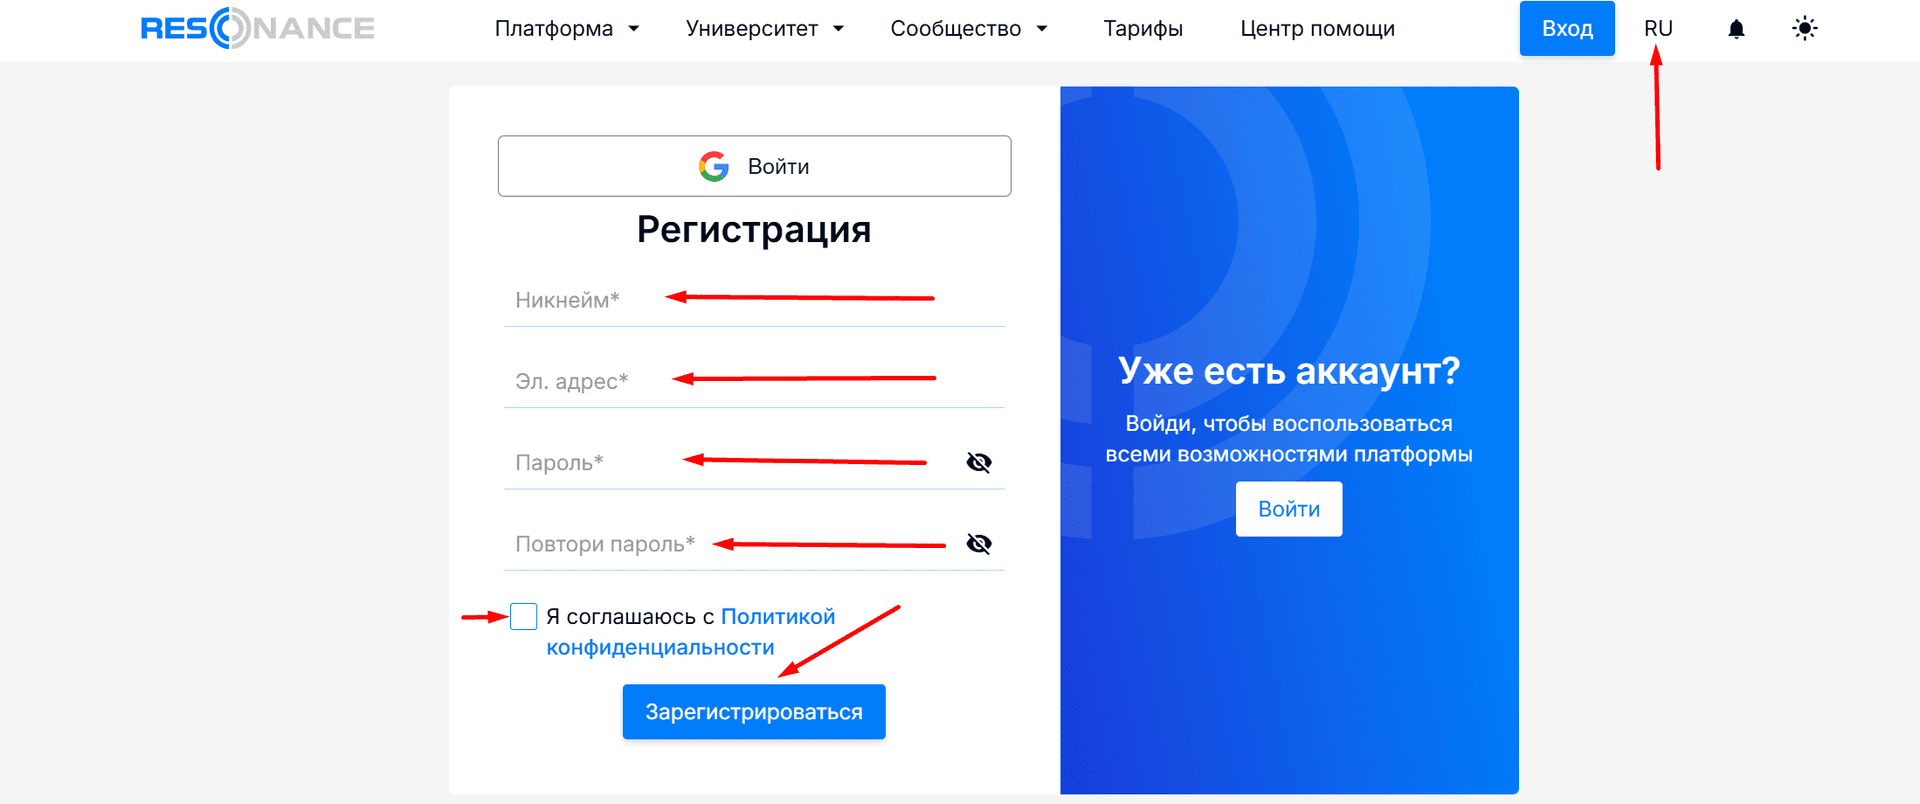
The registration process on the Resonance.Vision platform is extremely simple and takes no more than a couple of minutes. The platform does not require identity verification (KYC), which is especially important for traders who value anonymity and speed of entry.
By registering through our referral link, you get two undeniable advantages! First, a bonus – 10% discount on the first purchase of a tariff on the platform. Secondly, and this is the most important and exclusive, cashback
from us in the amount of 11.25% of the cost of any tariff. This cashback applies to both the first and all other tariff payments. You will not find such fat conditions anywhere else!
So, go to the official site resonance.vision by our referral link, immediately change the language to Russian in the upper right corner and fill out the registration form: nickname, e-mail address, password twice, agree with the privacy policy and click on the “Register” button.
After submitting the form, check your e-mail – you will receive an e-mail confirming your registration. Follow the link in the email to activate your account. After activation of the account we can log in using login (email) and password. At the first login on the main page, the system will offer to choose a language and then watch some informational and educational materials. It is possible to enable Two Factor Authentication (2FA) in the account settings to increase security.
Pros:
Minuses:
Resonance.Vision is not just another platform to view prices and candlesticks. It is a powerful professional-level tool that combines market analytics based on volumes, clusters and deltas with deep customization capabilities and proprietary education.
The platform offers a truly unique approach: aggregated indices, screeners with multiple levels of filtering, dashboards for comprehensive market monitoring, signals based on behavioral analysis, as well as tools for working with limit orders. All this allows you not just to follow market movements, but to understand the reasons for changes and predict the behavior of major players.
The strong point of Resonance.Vision is its modularity, because the user can build his own workspace for his tasks, from scalping to medium-term arbitrage. The functionality is constantly being developed, new sections and tools are added. The possibility to test the main functions on a free tariff makes logging into the system accessible to a wide range of traders.
However, it is important to realize that the platform requires the user to be skilled in advanced metrics. Without a basic understanding of how volumes, liquidity and delta work, ResonanceVision’s tools can seem complicated.
Bottom line, Resonance.Vision is a platform for those looking to go beyond traditional chart analysis. If your goal is to see the market deeper than the crowd sees it, build sound trading ideas and work with real liquidity flows, Resonance.Vision is definitely worth your attention.
Write or call us. We will help you quickly re-register your accounts. Enjoy a new level of trading with cashback every month.
You are used to trusting professionals in your everyday life. Trust us with your interactions with exchanges. You won't want to go back to trading without Feebacker.com.


 Telegram app