


Trading is not a game of chance. The more data you see, the higher your chances of making the right decision. Today, the market offers a wealth of tools: charts, indicators, robots. But if you trade in crypto, especially intraday, standard solutions are often not enough, because the market has become faster, smarter, and more complex. You need a tool that shows what is happening behind the candlesticks: where liquidity is concentrated, how large orders are moving, and what other market participants are doing right now. TradingLite, a platform that changes the approach to technical analysis, offers exactly that.
TradingLite is a platform that makes the invisible visible. It shows where large limit orders are placed, how liquidity moves, and how the battle between buyers and sellers actually plays out. This tool helps you understand what is happening inside a candlestick rather than guessing. This TradingLite review will examine how the platform differs from other platforms of this kind, what its features are, and how to use it to gain a real advantage in the market. We will also look at what real-time order analysis is, where to look at liquidity in trading, where to see the cryptocurrency glass, what market liquidity visualization is, and what a cryptocurrency heat map is.
TradingLite emerged as a solution to a simple problem: most traders only see the chart, but not the market. Founded by a small team of enthusiasts, the platform was originally created to visualize the real state of the order book—so that you could not just guess, but see where the key liquidity levels are and who controls them.
TradingLite is known to be headquartered in Brussels, Belgium. The idea was born in 2019, when interest in order flow and glass analysis began to grow among crypto traders. The creators of TradingLite decided to adapt an approach that has long been used in traditional markets (such as Bookmap) to the dynamics of cryptocurrencies. The platform quickly gained attention thanks to its unique heat map, which shows limit orders in real time.
Since then, the project has been actively developing: footprint charts, custom indicators, integrations with major crypto exchanges, and a user-friendly interface for scalpers have been added. The team regularly releases updates based on real trader requests. All this has made TradingLite one of the best platforms for analyzing liquidity and order flow in the cryptocurrency sphere.
To understand how the market works, it is not enough to look at candlesticks and moving averages. TradingLite provides access to tools that reveal the real mechanics of price movement: where limit orders are placed, who is buying, who is selling, and how aggressively. These features are especially valuable for active traders—scalpers, day traders, and those who want to enter positions more accurately. Below are the key tools that make TradingLite a strong player among liquidity and volume analysis platforms.
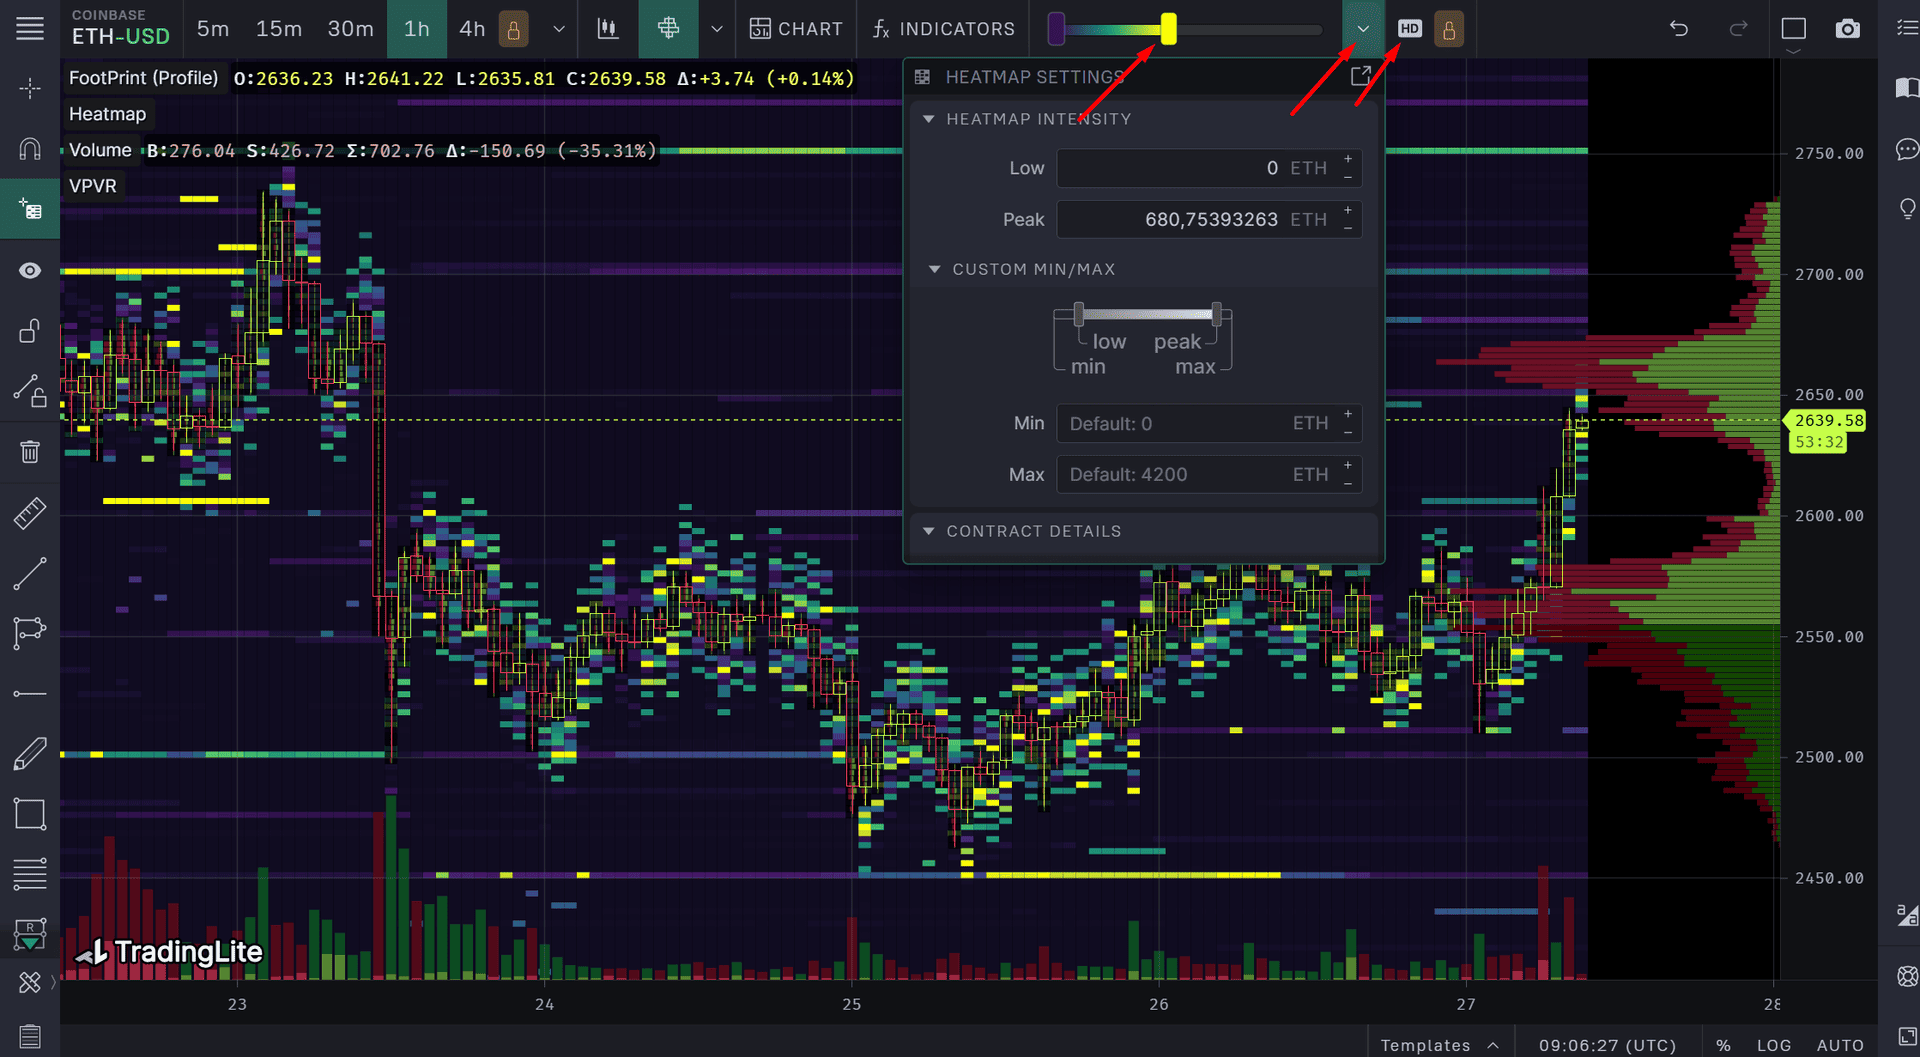
The cryptocurrency heat map is one of TradingLite’s main tools, providing X-ray vision into the market. It visualizes liquidity in the order book: where limit orders to buy and sell are placed, how dense they are, how quickly they appear, disappear, or change. All of this is visible on the chart in the form of colored blocks. It is a powerful way to observe the battle between supply and demand in real time.
What the heat map shows:
Please note that the brightness of each block reflects the density of liquidity. The brighter the block, the more limit orders there are at that level. Thus, if the block becomes brighter, liquidity at that level increases. If it dims, orders are removed. If it disappears completely, it means that the volume at that level has become zero (cancelled or executed).
Heat map settings:
A very useful tool is Heatmap Lens, a magnification tool, a magnifying glass that automatically appears when you hover your cursor over a single point. It shows the exact liquidity value in the blocks next to the cursor without having to manually zoom in on the chart. Press “L” to turn Lens on or off. Use the ‘Shift’ key to fix the cursor horizontally to view one price over time. The “Alt” key fixes the cursor vertically, allowing you to analyze all price levels at a given moment.
The cryptocurrency heat map in TradingLite is a visual representation of limit orders in the order book. It allows traders to see where market participants are placing buy and sell orders and how these levels affect price movements. It provides a real opportunity to view changes in order placement over the past 3 years across more than 15 exchanges and more than 400 trading pairs. It is a powerful tool for in-depth market analysis, allowing you to make more informed trading decisions and read the intentions of market participants.
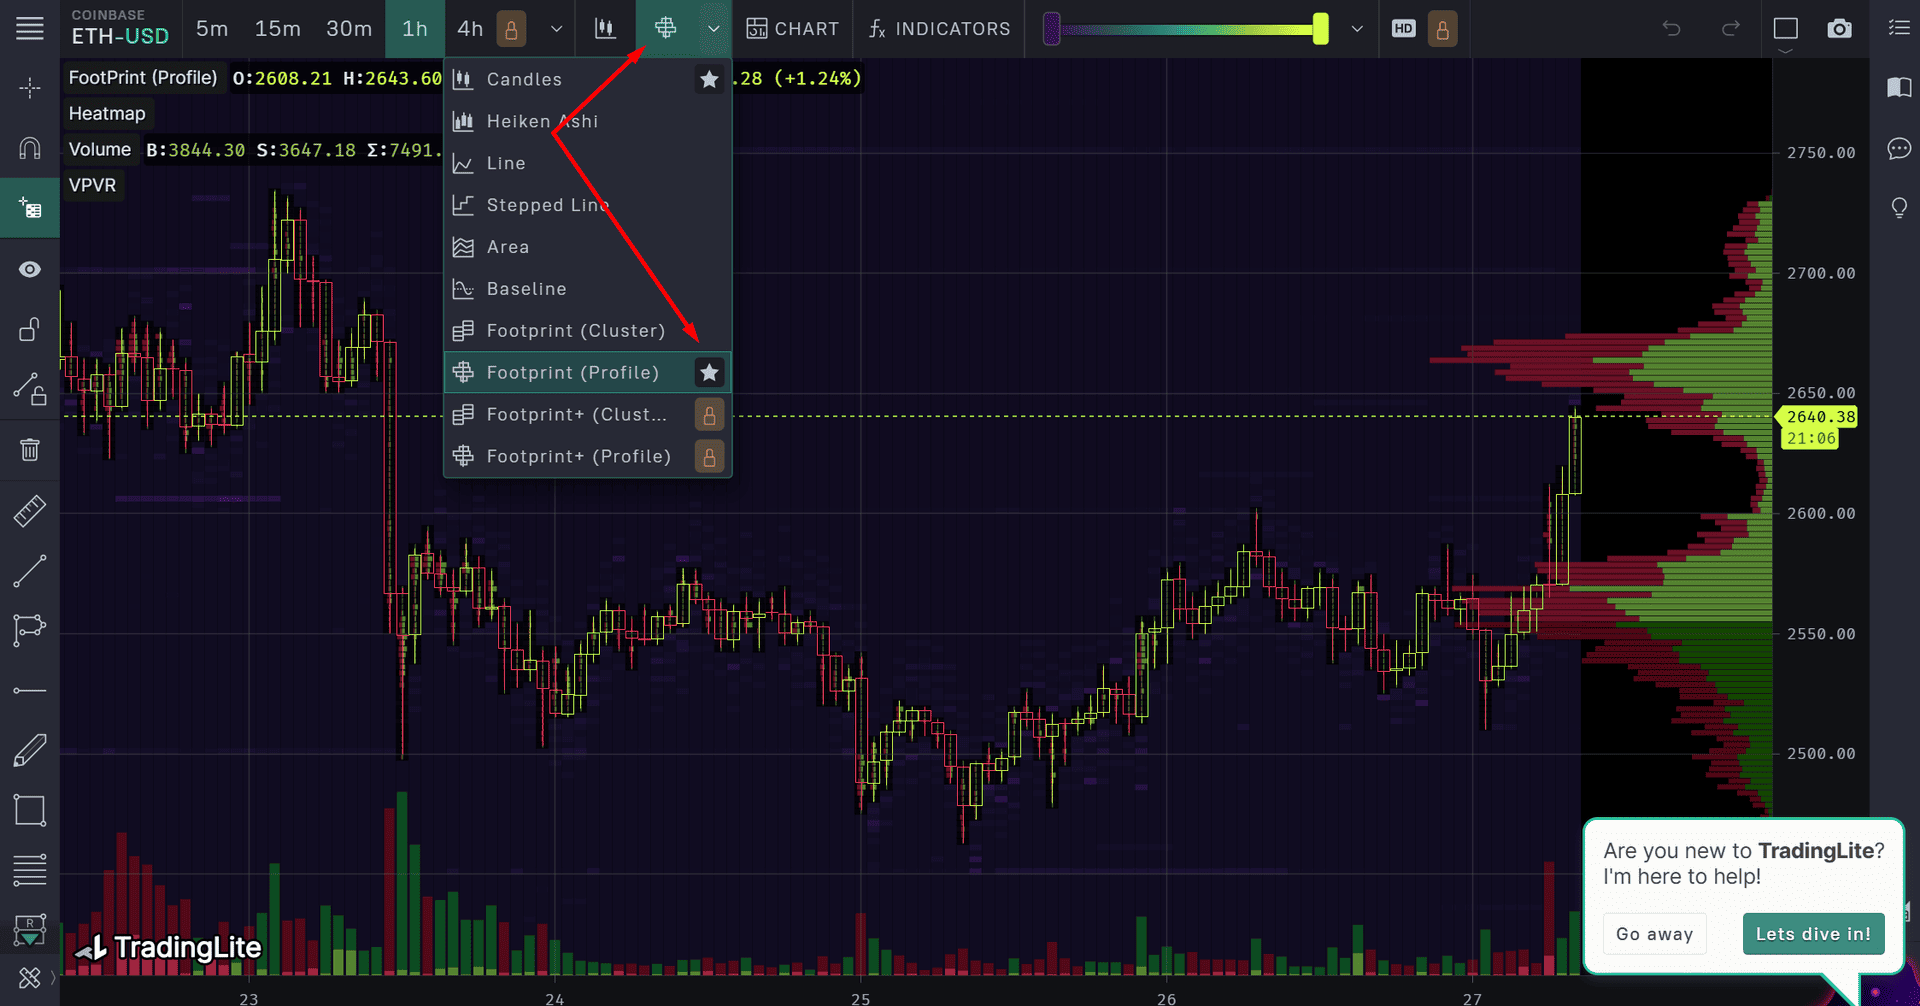
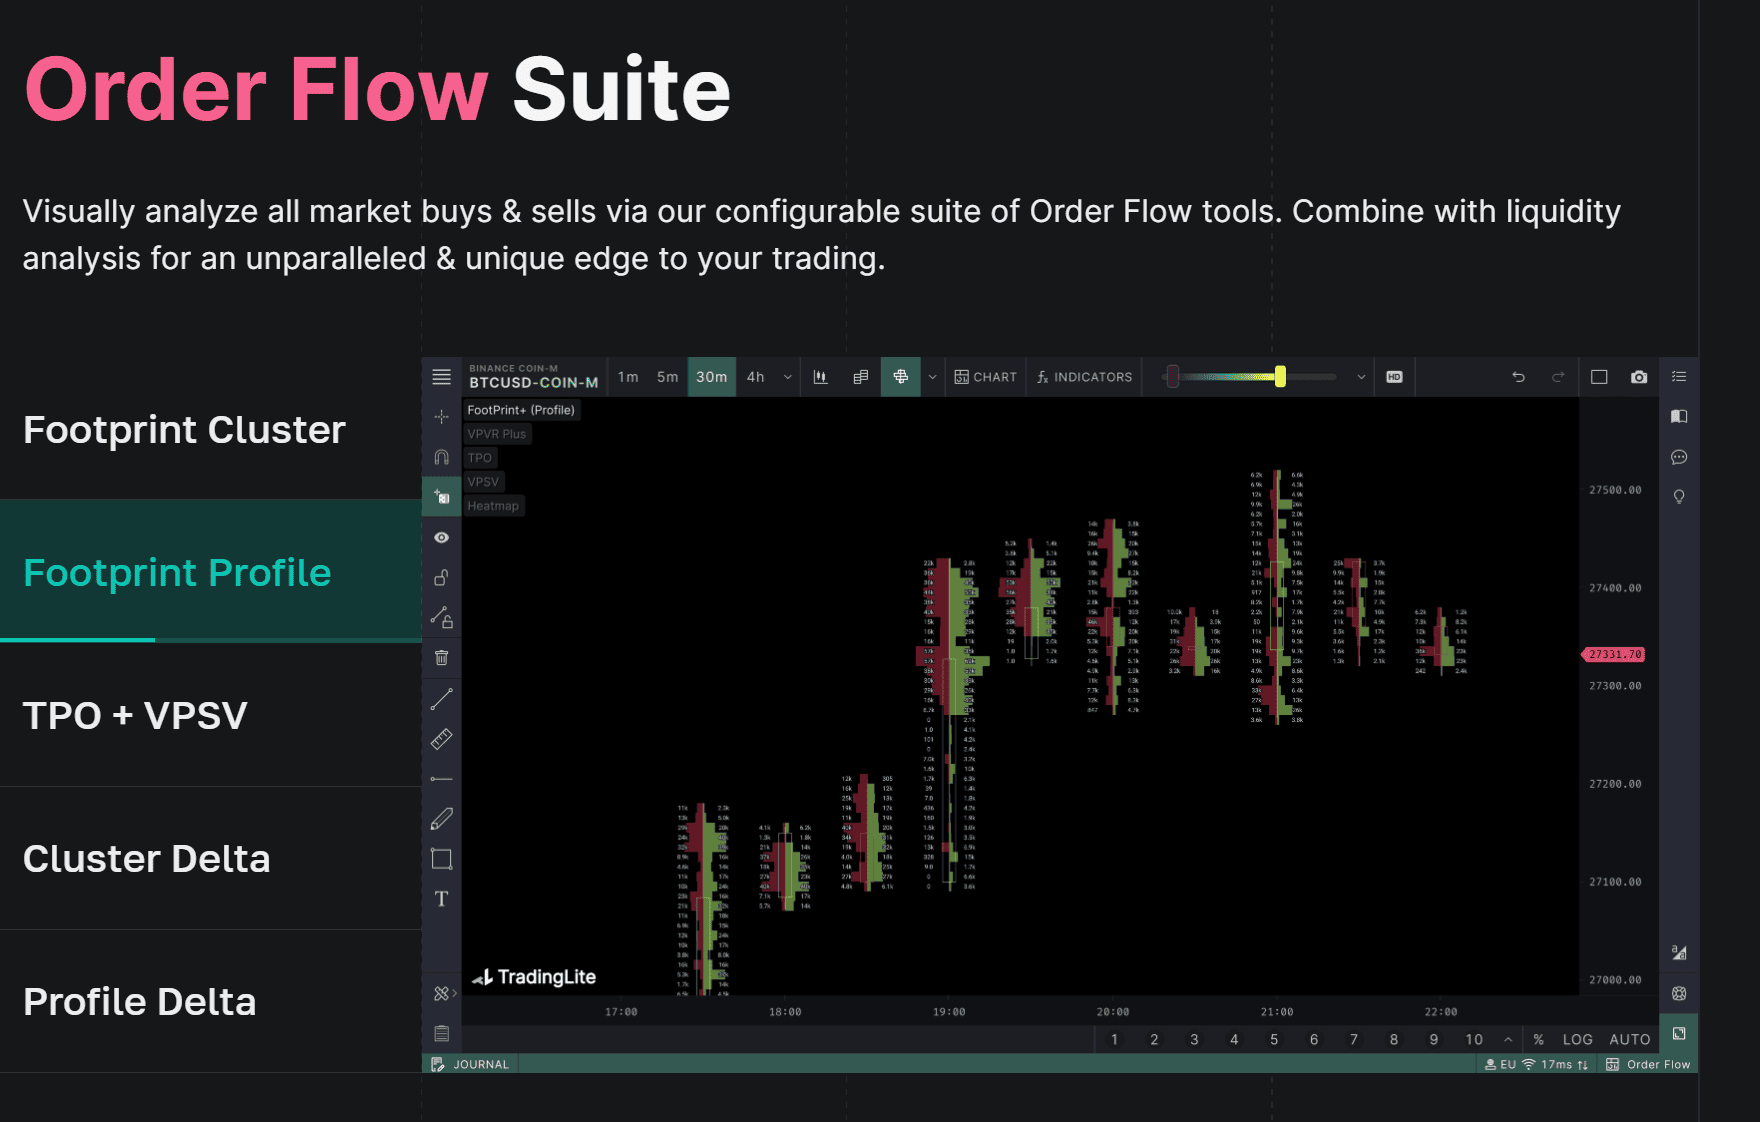
Footprint TradingLite is a powerful visual tool that allows you to look inside each candlestick. It shows not just the price and volume, but the distribution of market orders by level: who was buying, who was selling, and where the aggression was taking place. Visually, it looks like rows of prices, where you can see how many market sales (bid) and purchases (ask) there were at each level. The platform offers several types of footprint displays: Profile, Cluster, as well as advanced versions Profile Plus and Cluster Plus.
What Footprint displays:
The settings allow you to adjust: delta per row, Ticks per row (level of detail), the method of calculating color gradation or row width (proportionally or per individual candle), candle aggregation intervals for a smoothed view.
Types of Footprint in TradingLite:
How to use?
The Footprint chart works in real time and pairs perfectly with the heat map and glass. You can customize it to your liking: adjust the color, data density, and filters by volume and imbalance. It’s perfect for scalpers because it gives instant feedback on activity at each price. For day traders, the tool will help confirm or refute signals from other indicators.
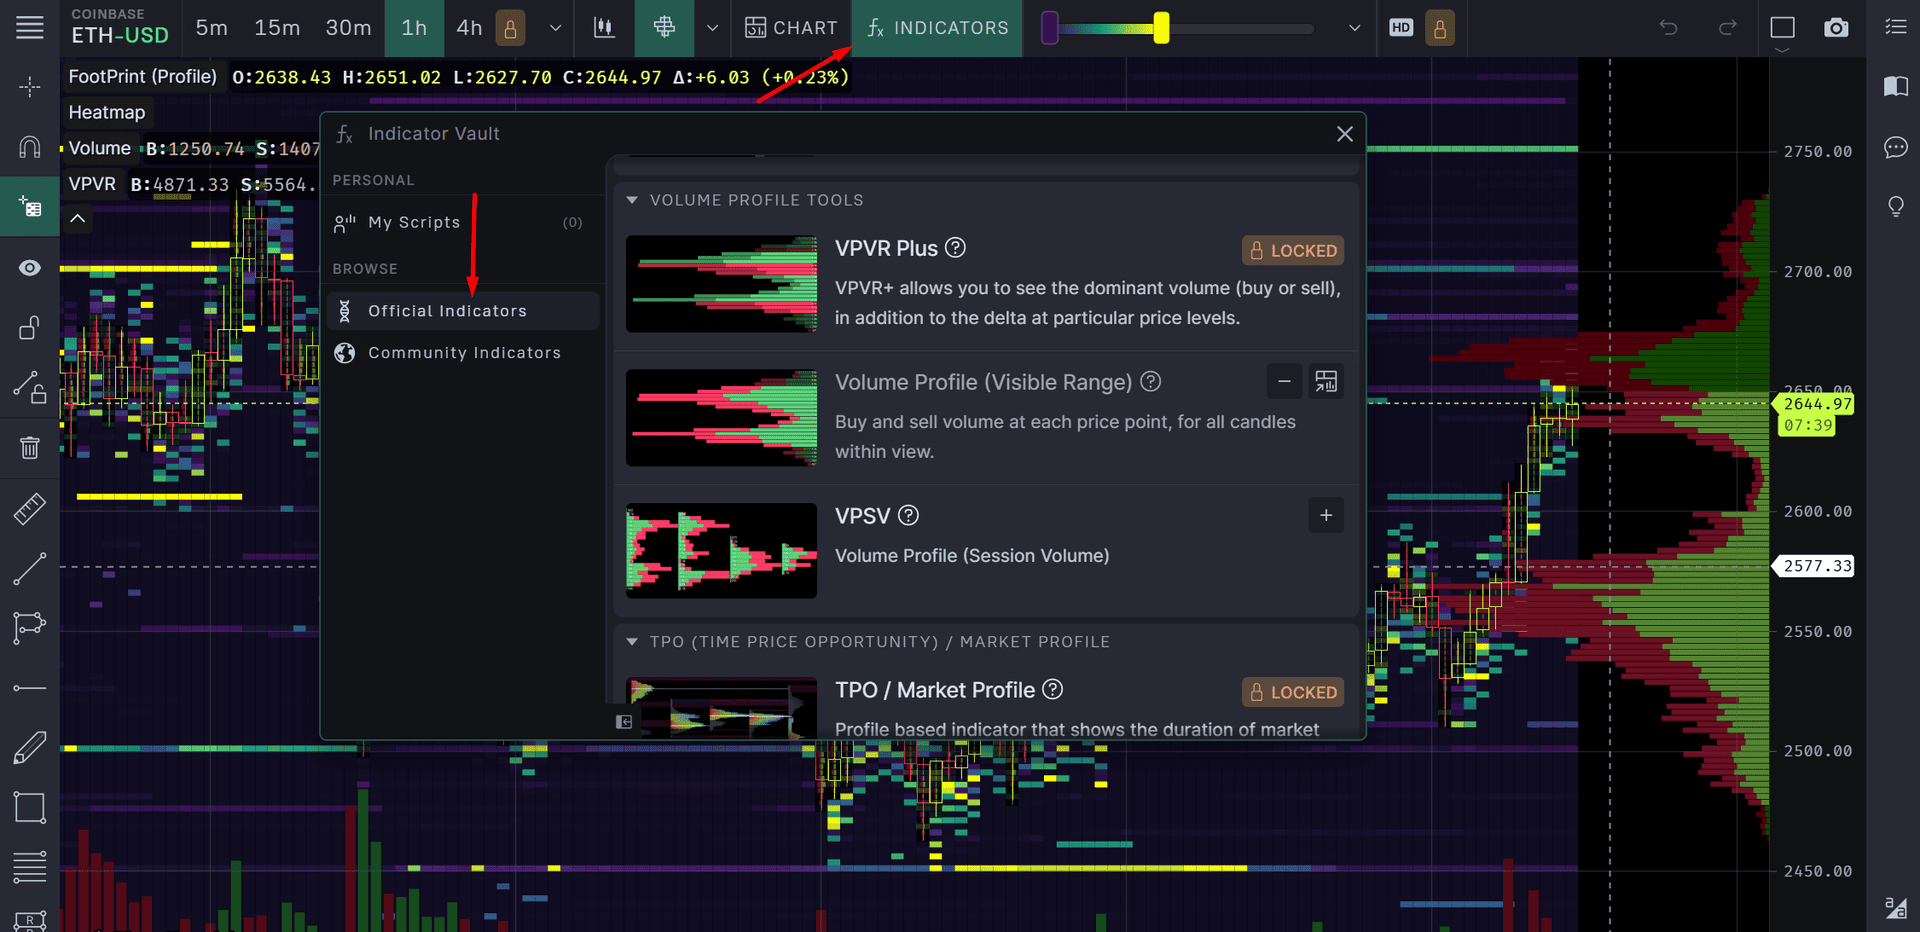
In TradingLite, the volume analysis tool is represented by Volume Profile indicators, including VPVR (Volume Profile Visible Range) and VPSV (Volume Profile Session Range). They display the volume of market purchases and sales at various price levels, which helps traders identify key support and resistance levels, as well as areas of high interest to market participants. This allows you to accurately determine where participants were most active, buying, selling, defending, or breaking through levels. Three Volume Profile options are available in TradingLite. These tools are part of the Order Flow Suite in TradingLite and can be activated via the platform’s indicator menu.
VPVR (Volume Profile Visible Range)
This indicator shows trading volumes at various price levels within the visible area of the chart. This allows traders to determine at which price levels the largest number of trades took place, which may indicate important support or resistance levels.
Volume Profile Visible Range features:
Paid packages include access to VPVR Plus. This is an advanced version of the profile with visual details of delta, balance, and aggression.
Visualization features:
This is one of the best tools for finding entry points on breakouts and rebounds.
VPSV (Volume Profile Session Range)
This indicator displays trading volumes within a given trading session, providing a more detailed view of market participants’ behavior during specific time intervals.
Basic settings: session type, POC (Point of Control), Value Area, Delta Mode (displays profile lines as a delta), Ticks per Row (adjusts the degree of compression of levels).
Volume Profile helps you see the market more deeply than regular candlesticks. It shows where the price actually lived, at what levels participants actively traded. This allows you to distinguish real levels from fake ones, because if there was no volume, the level will easily break through. The delta and visual balance for each level indicate who controlled the price—buyers or sellers. All this makes Volume Profile a powerful tool for accurate entry and assessing the strength of the movement.
Order Book Profile is a real-time liquidity visualization tool that displays current limit orders to buy and sell at various price levels. It allows traders to analyze market depth and identify key support and resistance levels based on placed orders. This tool is particularly useful for assessing market sentiment and potential price reversal points.
By analyzing clusters of limit orders, you can identify levels where the largest number of orders are concentrated, which may indicate strong support or resistance levels. And by comparing the volume of buy and sell orders, traders can determine which side, buyers or sellers, is dominating the market at the moment. In addition, detecting significant changes in the structure of orders can signal possible breakouts or rebounds from levels, which helps in making trading decisions.
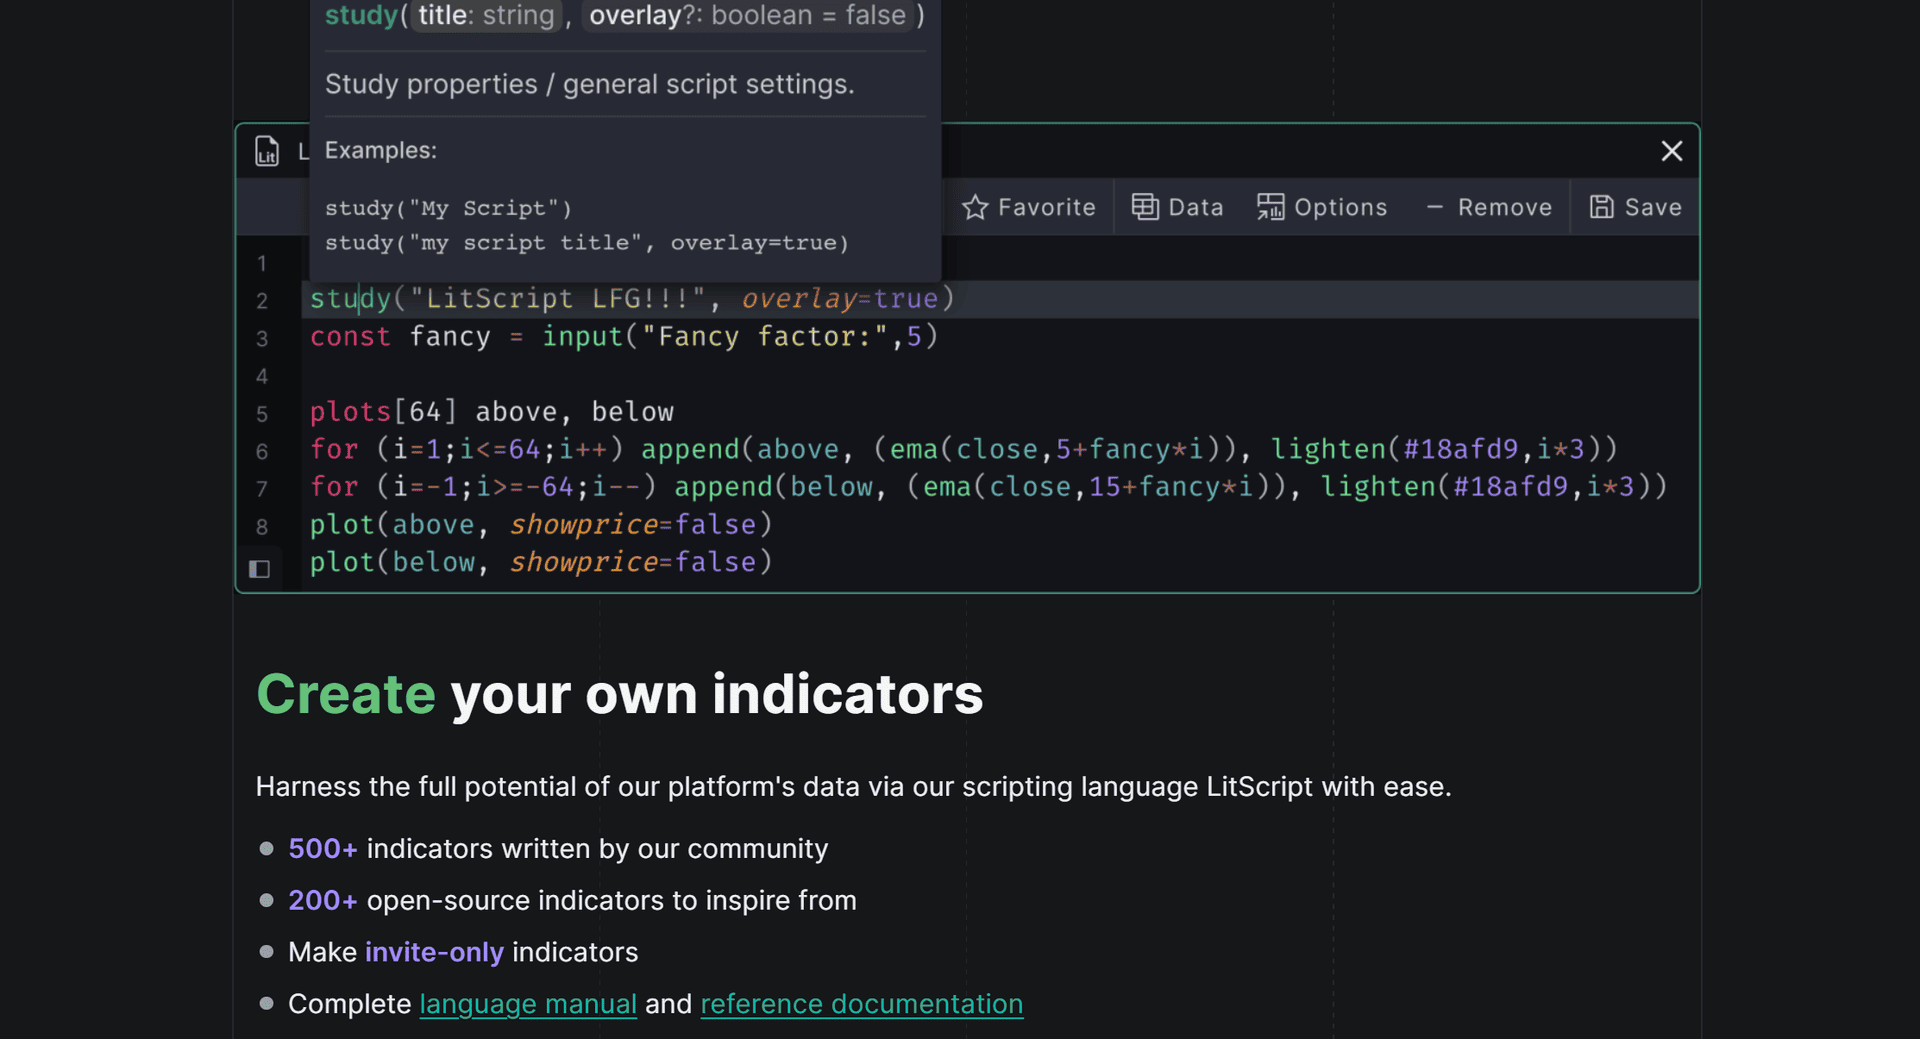
TradingLite is not just visualization. It is an environment where you can create your own indicators to suit your trading style. All this is implemented through LitScript, a built-in scripting language similar in syntax to TradingView’s Pine Script, but adapted to the TradingLite ecosystem and its unique tools: heat maps, footprints, cluster charts, and more.
TradingLite allows you to:
The LitScript editor allows you to write code, test it live, and save it to the library. All indicators can be applied as layers, edited parameters, and customized visualization.
This tool can be used to implement: custom levels and zones (based on volume, liquidity, delta, etc.); algorithmic signal filters; automatic alerts; personalized volume and POC profiles; indicators based on footprint interaction and heat maps.
In addition, we have a ready-made library of scripts created by the community at our disposal:
LitScript makes TradingLite not just an analysis tool, but a platform for building your own trading environment. If you know what you want to see on the chart, LitScript can help you make it happen.
TradingLight offers various pricing plans suitable for both beginners and experienced traders. Don’t forget that by registering via our referral link https://www.tradinglite.com/join?ref=Feebacker, you will receive a $30 discount on the purchase of an annual package and $10 on the purchase of a monthly package.
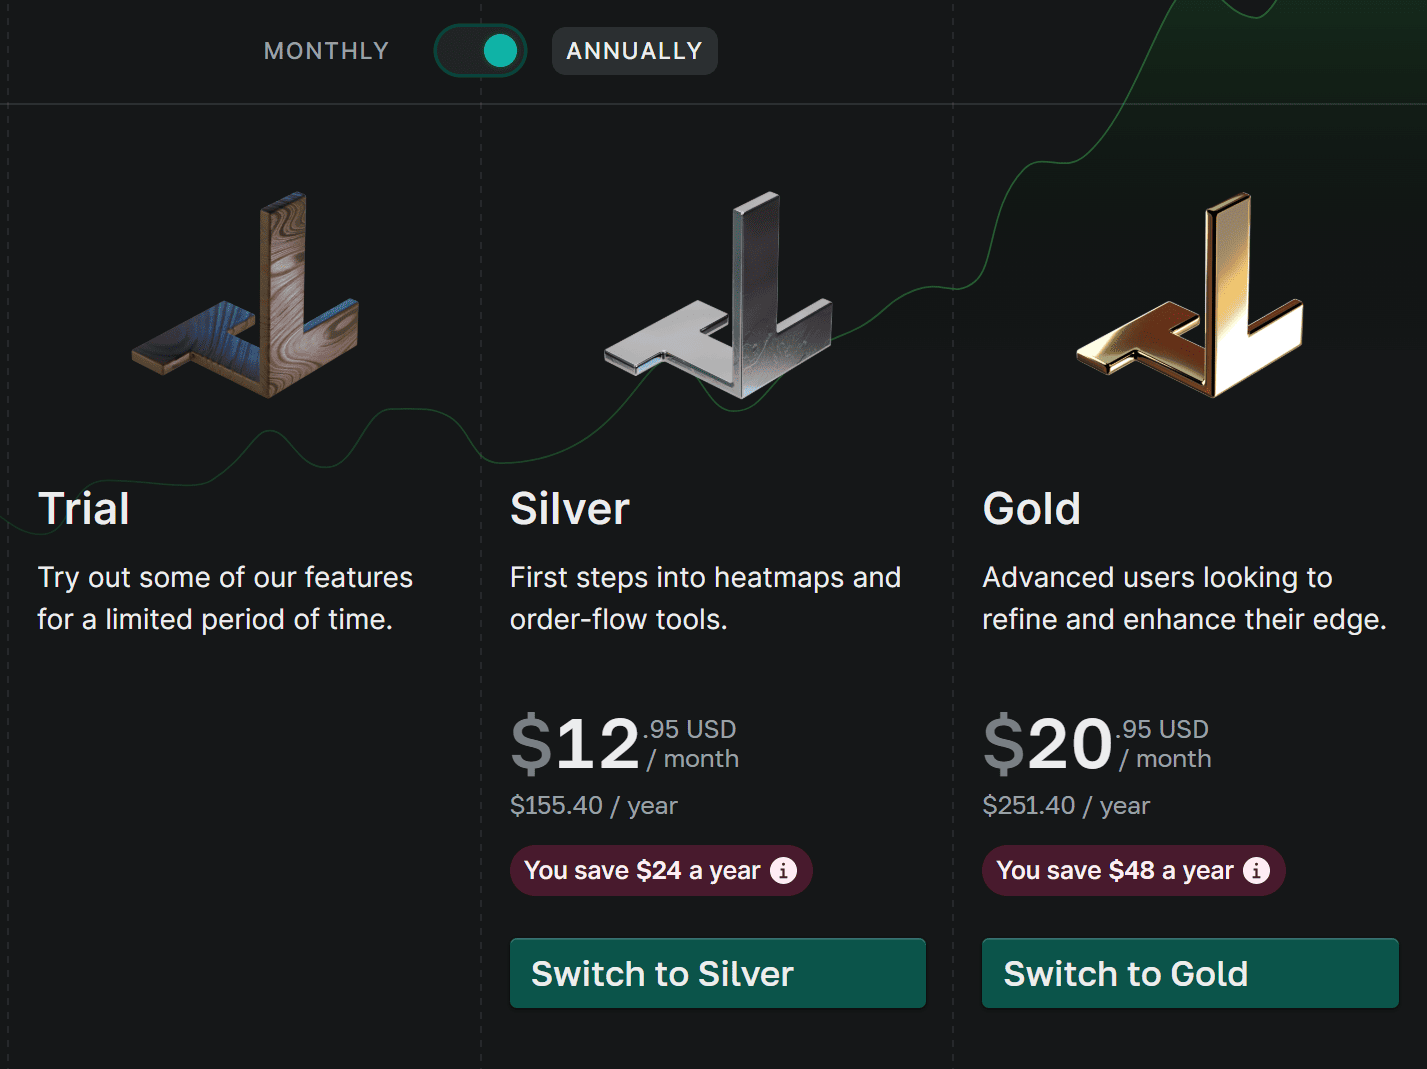
Silver
Cost: $12.95 per month or $155.40 per year (save $24 with annual payment).
Features:
Gold
Cost: $20.95 per month or $251.40 per year (save $48 with annual payment).
Features:
Duration: 7 days.
Features:
Registering with TradingLite takes just a couple of minutes and does not require you to enter your payment details right away. The only thing that might cause difficulties is the lack of Russian localization on the official website.
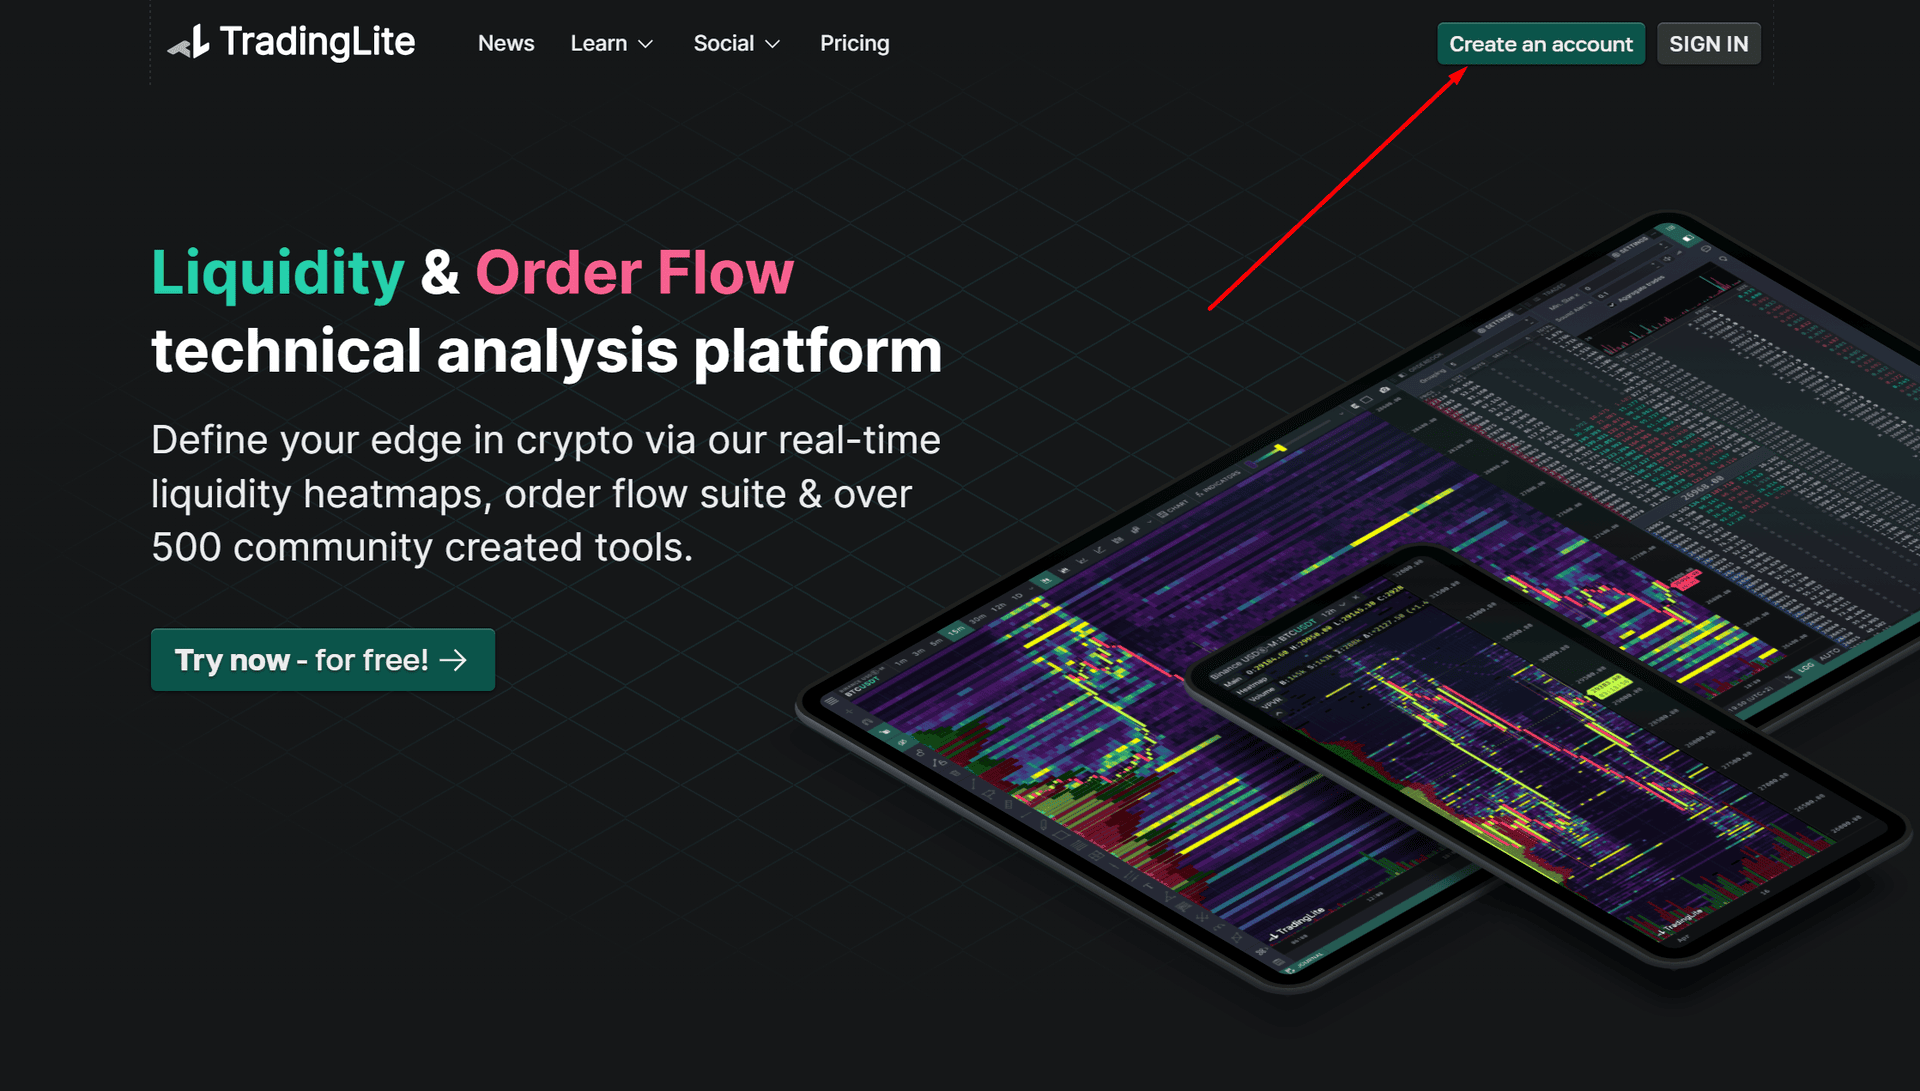
So, go to the official TradingLite website via our referral link https://www.tradinglite.com/join?ref=Feebacker, which will give you a number of additional benefits and bonuses (you get a $30 discount on the purchase of an annual package and $10 on the purchase of a monthly package). In the upper right corner of the website, click on the green “Create an account” button.
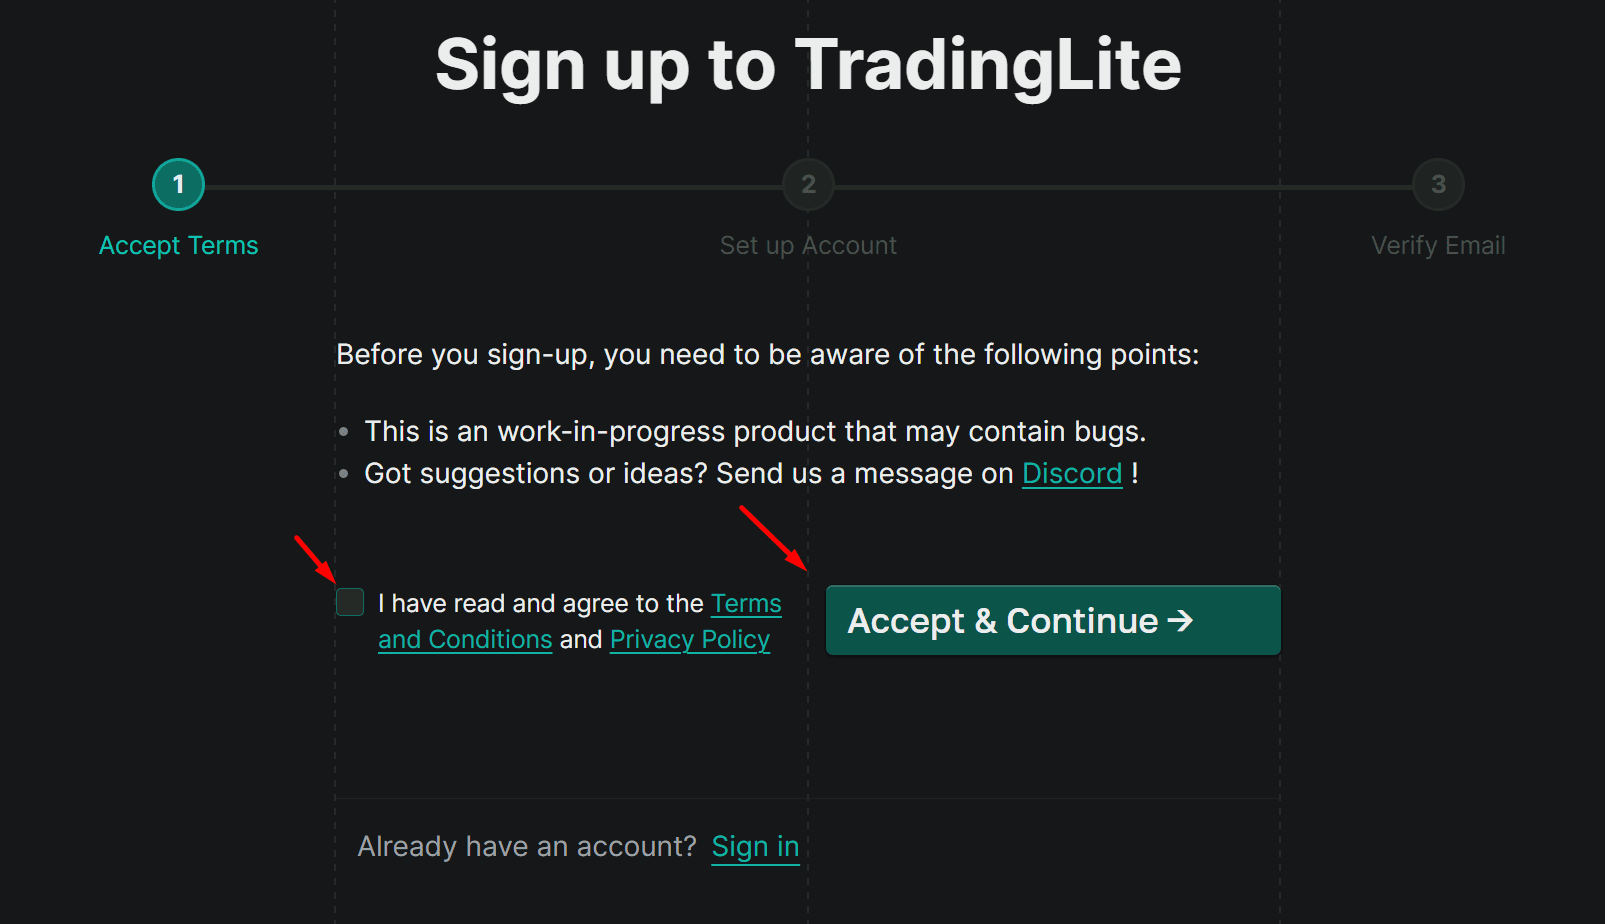
Next, check the box to agree to the platform’s terms and conditions and privacy policy, and click on the “Accept & Continue” button.
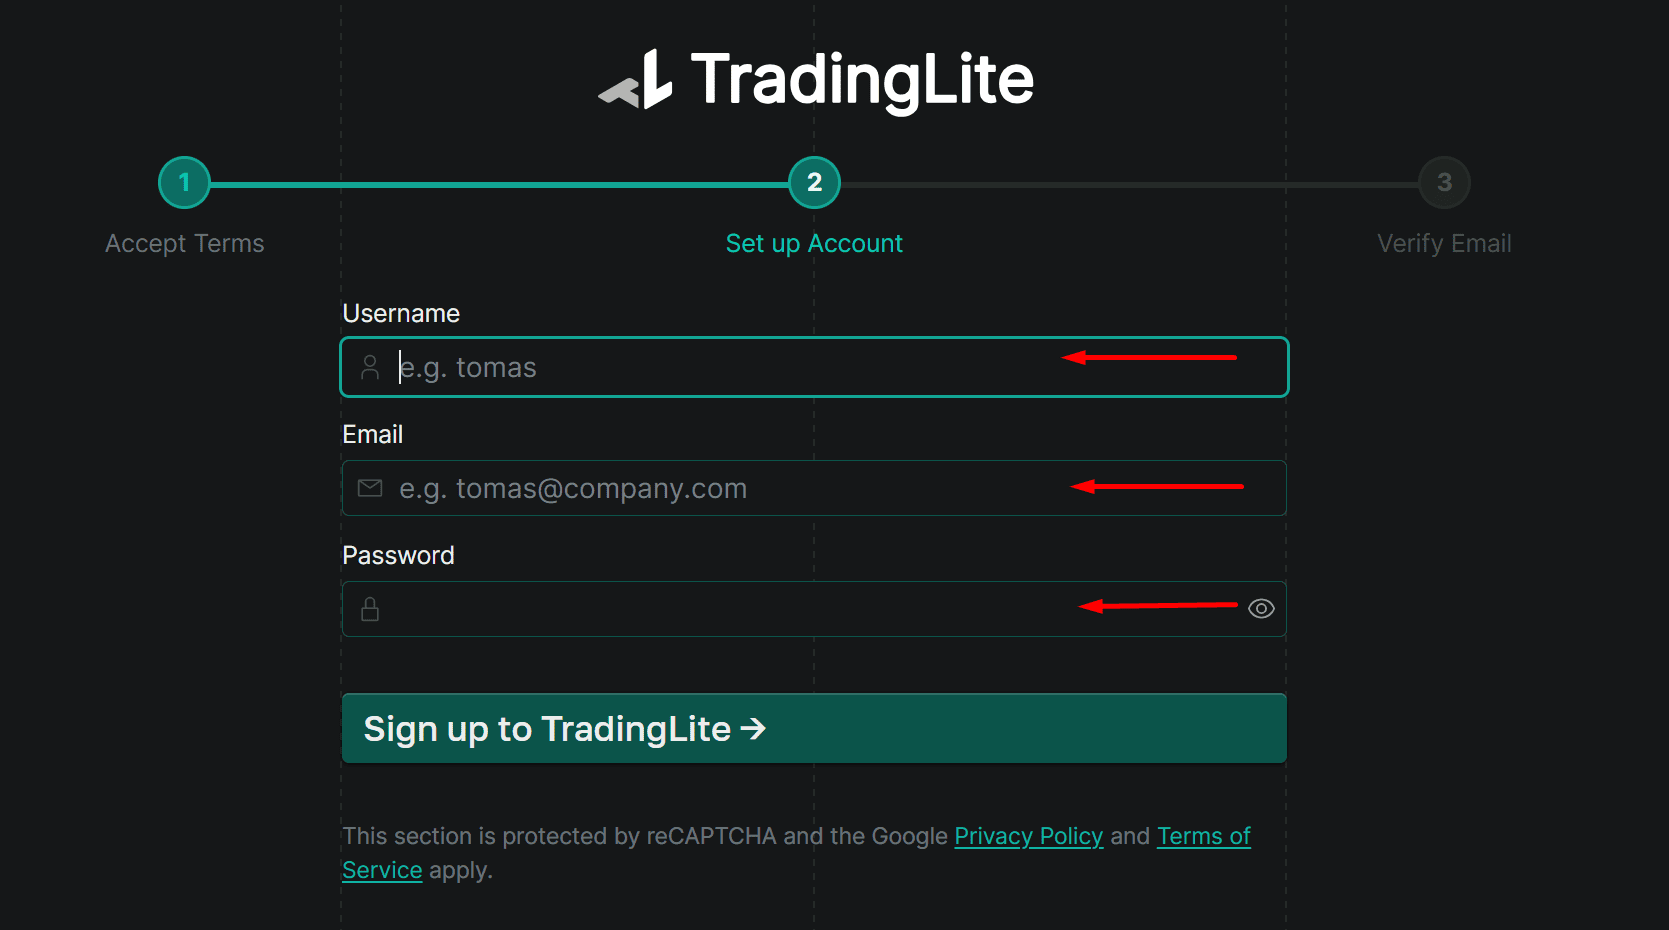
In the next step, enter your username, email address, create a password, and click the “Sign up to TradingLite” button below.
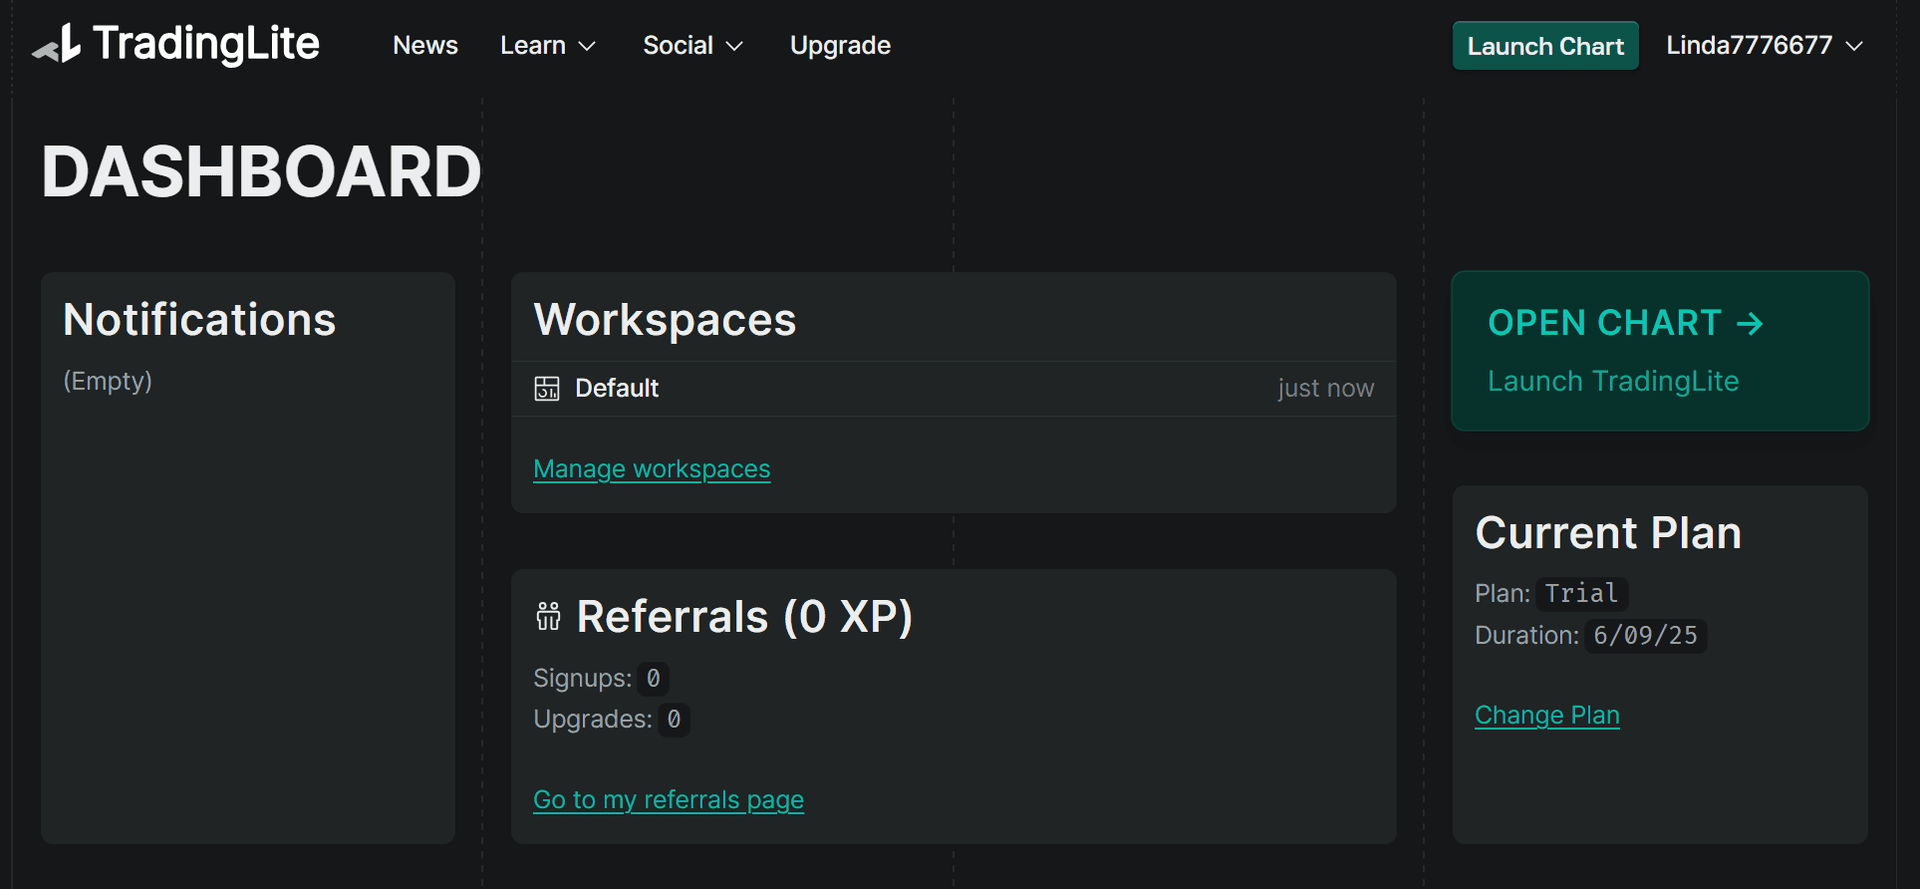
Now you need to go to the email address we provided and click on the link to verify your email. After clicking on this link, the system will automatically redirect you to your TradingLite personal account. At this point, the registration process can be considered successfully completed, but you can immediately click on “Manage workspaces” to proceed to the initial setup of your workspace.
The system will offer a simple 4-step setup. In the first step, you need to select a theme: dark, light, or auto. In the second step, select the type of chart display. We recommend selecting “Default” initially (you can change it at any time in the settings). Step 3 offers you to choose the color scheme of the charts: Default, Midnight City, or Candyland (it’s a matter of taste, as they say). And the last step is to configure the interface: Chart, Full, or Full Staked (we recommend setting it to Full initially). That’s it, click the “Start using TL” button and let’s go.
To access full functionality (heat map, footprint, advanced indicators), you need to switch to a paid plan, which, by the way, has a trial period. If you are a beginner, start with the free mode. It will be enough to learn the interface and understand whether you need this tool.
Pros:
Minuses:
TradingLite is not just another chart with colored candles. It is a comprehensive tool for analyzing market mechanics, created for those who want to understand how the market really works. The platform shows not only what is happening, but also why it is happening, and does so clearly, quickly, and conveniently.
If you are used to relying on standard indicators such as RSI, MACD, and candlestick analysis, TradingLite may seem excessive at first. But once you get into it, it becomes clear that this is simply a tool of a different level. It gives traders something that classic terminals don’t have: visual access to real demand, supply, and price competition. This is especially important in crypto, where everything is often decided in a matter of seconds.
The platform is ideal for: scalpers and day traders; those who trade volume, liquidity, and levels; traders looking for confirmation of entry points; analysts who need to understand the behavior of large market participants.
Is it worth paying for a subscription? If you take trading seriously and rely on real data rather than guesswork, then yes, definitely. Even the basic plan offers useful features, while the Gold version unlocks the platform’s full potential (HD graphics, extended footprints and profiles, its own scripting language).
The platform has its drawbacks, and they are not hidden: no trading from charts, a threshold that is not the easiest for beginners to cross, and paid access to full functionality. But these are not bugs — they are conscious choices.
TradingLite is like turning on X-ray vision for charts. Those who know how to use it gain an advantage!
Write or call us. We will help you quickly re-register your accounts. Enjoy a new level of trading with cashback every month.
You are used to trusting professionals in your everyday life. Trust us with your interactions with exchanges. You won't want to go back to trading without Feebacker.com.


 Telegram app