


Trading today is not the same as it was ten years ago. Access to markets has become easier, analytics has become more accurate, and competition has become tougher. Therefore, the question of what tool to use to analyze and trade is particularly acute.
TradingView is one of the most famous services among traders and investors all over the world. Some call it the best platform for technical analysis, others criticize it for the limitations of the free version. But before making conclusions, it is necessary to understand what TradingView actually offers.
In this article, we will try to put everything in order and find out: what TradingView is in practice, what opportunities are provided by free and paid subscription, how the registration and the real workflow on the platform are carried out, what pros and cons the service has, who TradingView is suitable for and who is not. No beautiful words and water. Only real experience and cold analysis.

TradingView appeared in 2011 thanks to a team of developers and traders who had previously worked on the MultiCharts platform for analyzing financial data. Founders Stan Bokov, Konstantin Ivanov and Denis Globa set a goal to create a service that would be accessible from any browser, would not require installing programs and would unite traders from all over the world into one community. It is noteworthy that Rostov residents Konstantin Ivanov and Denis Globa have been friends since childhood and managed to try their hand at various enterprising ventures from an early age.
TradingView was initially launched as a simple online chart editor with the ability to share trading ideas. Unlike most competitors of that time, the platform immediately focused on ease of access, minimal interface and speed of work via the cloud.
Rapid development began after 2013, when support for stocks, currencies, cryptocurrencies appeared, the introduction of its own programming language Pine Script allowed clients to create their own indicators and strategies, and a marketplace for third-party developers was opened. In 2016, the platform began to actively integrate with brokers, providing the opportunity to trade directly from the chart. In parallel, the community grew, thousands of trading ideas began to be published on the platform every day, and the best analysts gathered tens of thousands of subscribers. By 2019, TradingView had become one of the largest trading platforms in the world, serving millions of users in over 150 countries. There were mobile apps, desktop version, support for a large number of languages and an expanding list of assets.
Today, TradingView is a true unicorn that is valued at over $3 billion dollars!
TradingView is not just a service for charting. It is a complete ecosystem for analyzing financial markets, creating trading ideas and even real trading. Here are the key features of the platform that you should know…
Powerful and flexible charts are at the center of TradingView. The platform offers a wide range of charts: candlesticks, bars, line charts, Renko, Heikin Ashi, Kagi, point-and-figure charts. All of them have flexible customization options: you can change colors, line thickness, customize the background, display price levels and time.
Very convenient scaling and scrolling tools, it is easy to work with both years of data and seconds charts. It is also possible to customize the chart once and save it as a template for further use.
An additional feature of TradingView is the ability to open up to 8 charts in one window (for Premium subscribers) – convenient for comparing assets.
TradingView offers more than 100 built-in indicators for technical analysis, including trend indicators (SMA, EMA, VWAP), oscillators (RSI, Stochastic, MACD), volume indicators (OBV, Volume Profile), volatility indicators (ATR, Bollinger Bands).
In addition to built-in indicators, TradingView library contains thousands of free custom indicators from other traders. It is noteworthy that each client has an opportunity to write their own indicator in the Pine Script language.
The trick – you can overlay indicator on indicator, for example RSI on MACD – to build more complex analysis systems.
TradingView provides the whole arsenal of tools for graphical analysis: trend lines, horizontal levels, vertical lines,… Channels: equilateral, linear, Fibonacci and others. Shapes: rectangles, triangles, ellipses…. Patterns: “head and shoulders”, “double top”, “wedges” and others. Fibonacci tools: levels, arcs, time zones.
The trick – all drawn objects can be linked to price values or timeframes so that they automatically adjust to the chart scale.
TradingView allows you to set alerts for almost any event: reaching a price level, crossing indicators, candlestick pattern formation, triggering a custom script and others.
The platform offers a number of ways to deliver alerts: pop-up window in the browser, Push notification to a smartphone, SMS (in paid subscriptions), Email.
The trick – you can set up complex conditions with Pine Script and get alerts on your strategies.
TradingView has built-in powerful scanners for: stocks (stock screener), forex (currency screener), cryptocurrencies (crypto-screener). We can easily filter assets by: volatility, trading volume, indicator readings and fundamental metrics (for stocks).
The trick – you can create your own scanners, saving filters and quick templates to find trading opportunities.
TradingView is integrated with several brokers such as: OANDA, FOREX.com, Alpaca, Tradovate and others. This means that we can open, modify and close orders directly from the chart, use one-click trading functions. In addition, it is possible to manage positions visually (drag and drop stops and take-profits).
The trick is testing trading strategies through a trading simulator on historical data.
TradingView is not only analysis tools, but also a large trader community. On the platform you can: publish trading ideas and forecasts, keep a personal blog, subscribe to successful traders, participate in open discussions in chat rooms, receive likes and comments.
The trick is you can raise your ranking in the community and earn authority, which is especially helpful for aspiring analysts.
TradingView is available not only through a browser. Mobile applications for iOS and Android allow you to work with charts, receive alerts and manage trades. The desktop application for Windows and Mac promises smoother operation compared to the browser versions.
The trick is the mobile app supports multiple charts and real-time alerts.
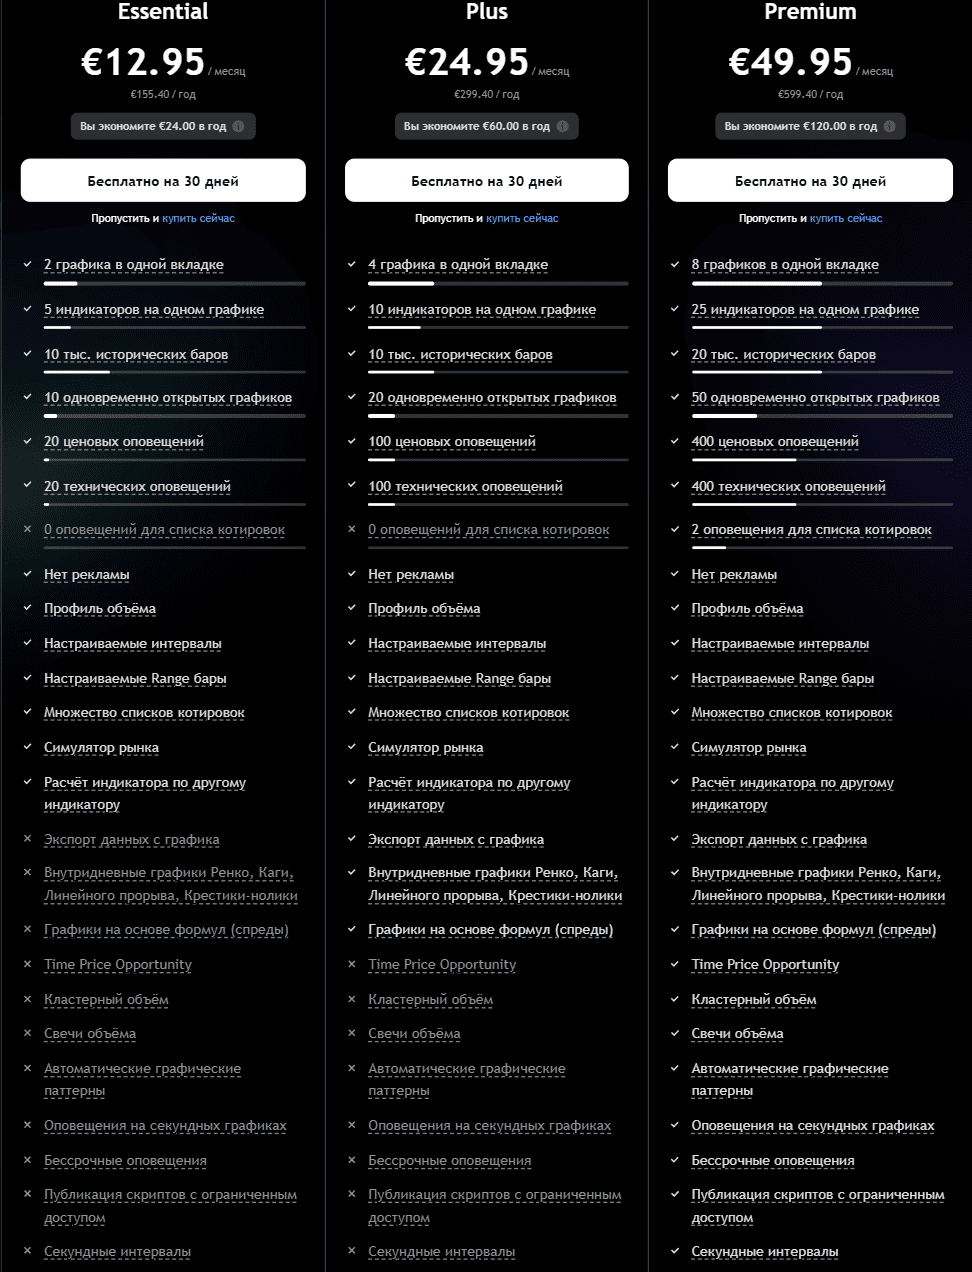
Although TradingView offers free access, its main features are only available with a paid subscription. TradingView has four tariff plans: Free, Pro, Pro+ and Premium. Let’s analyze in detail which plans are available and how they differ.
The free plan is suitable for those who are just starting out. It gives access to one chart per tab, allows you to use up to three indicators simultaneously, create basic alerts for changes in price or indicator conditions. However, the free version is limited: ads appear, it is impossible to open several charts simultaneously, the number of saved workspace layouts is also limited.
The “Essential” tariff is designed for beginner traders. Two charts in one window are available here, you can overlay up to five indicators on the chart, create up to twenty alerts simultaneously, use non-standard timeframes, for example, two-minute or three-minute charts. Pro is suitable for those who are starting to build their first trading systems and actively monitor several assets.
The “Plus” tariff is designed for those who work with several markets simultaneously. It offers up to four charts in one window, up to ten indicators per chart, up to one hundred alerts, export of historical data, and the ability to work on several devices simultaneously without logging out of the account. This plan is optimal for active traders analyzing crypto, stocks and currencies in parallel.
The Premium plan offers maximum platform features. Up to eight charts in one window, up to twenty-five indicators per chart, up to four hundred active alerts, the ability to create alerts without expiration date, priority technical support, minimal data update latency – all this makes Premium the choice of professional traders managing multiple portfolios and working with voluminous trading systems.
As for pricing, the free plan costs $0, Essential costs $14.95 per month or $155.40 per year, Plus costs $29.95 per month or $299.40 per year, and Premium costs $59.95 per month or $155.40 per year. Obviously, if you subscribe for a year at a time, you can get a significant discount. It is important to keep an eye on promotions, because on Black Friday and New Year sales discounts can reach up to fifty percent. You can pay for the subscription by bank card, via PayPal, with Apple Pay or Google Pay in mobile applications. Cryptocurrency payment via BitPay is available in some countries.
Do I need to buy a subscription right away? No. If you are just starting out, the free version will be quite enough to understand how the interface works and what features you really need. For active trading on several markets, you should consider Plus or Premium. Essential is usually enough for beginners: its features are enough to create the first trading systems and fully analyze charts. For professionals, there are additional Expert and Ultimate plans, but their cost starts from 100 dollars per month.
Getting started with the platform is easy, you just need to go to the official TradingView website via our referral link, which will give you a great opportunity to get a bonus $15 when you buy a subscription.
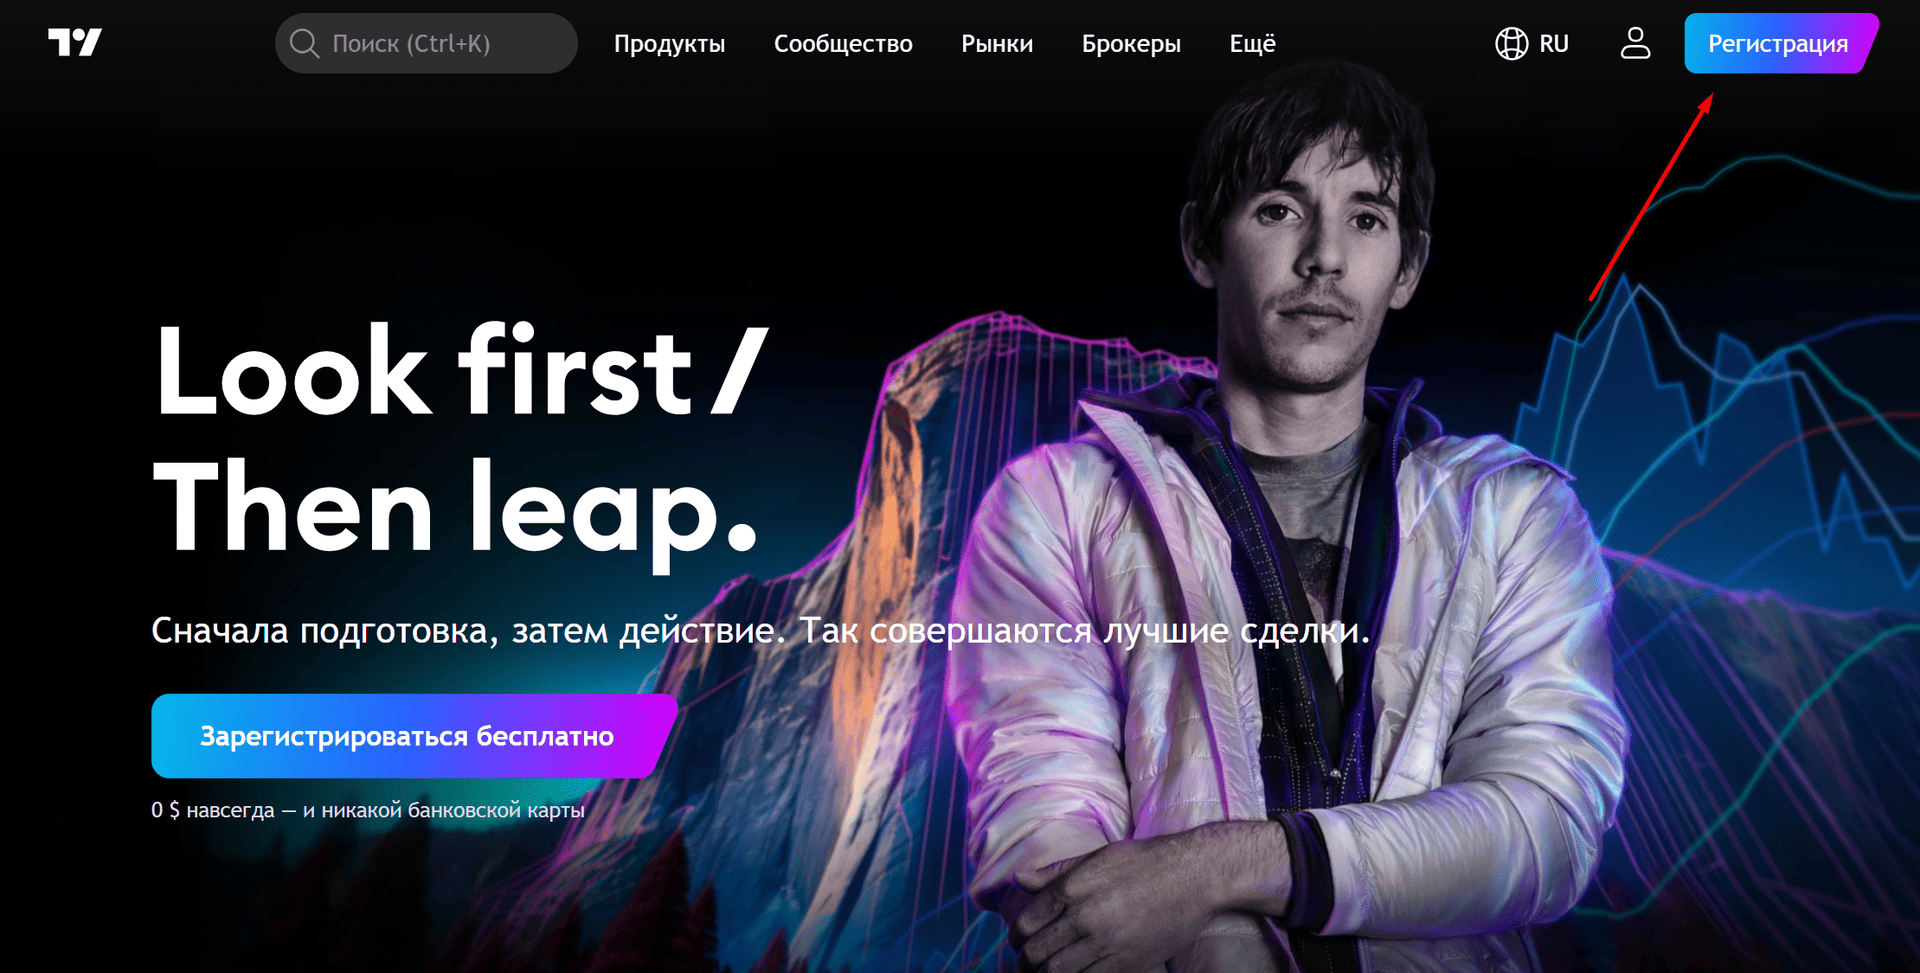
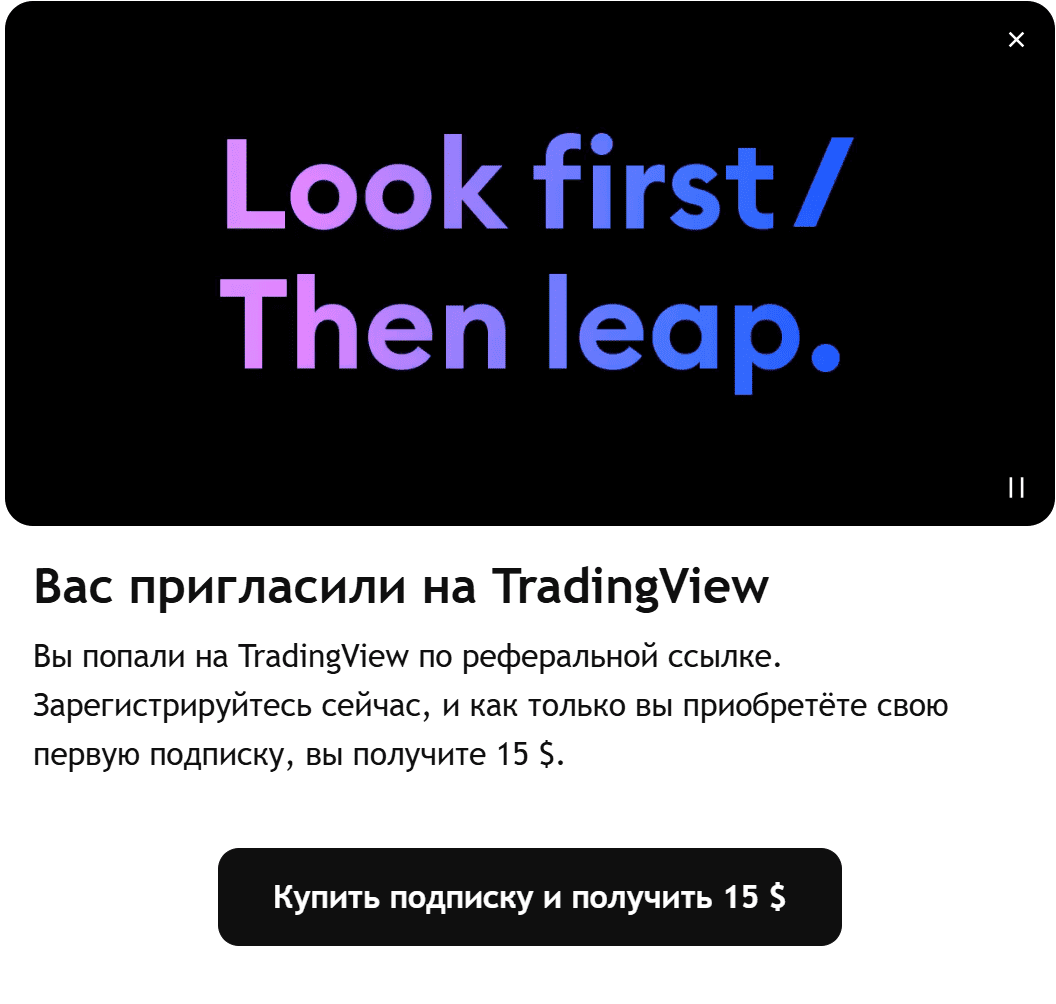 If we don’t plan to buy a subscription yet, we close this pop-up window and click the “Register” button in the upper right corner.
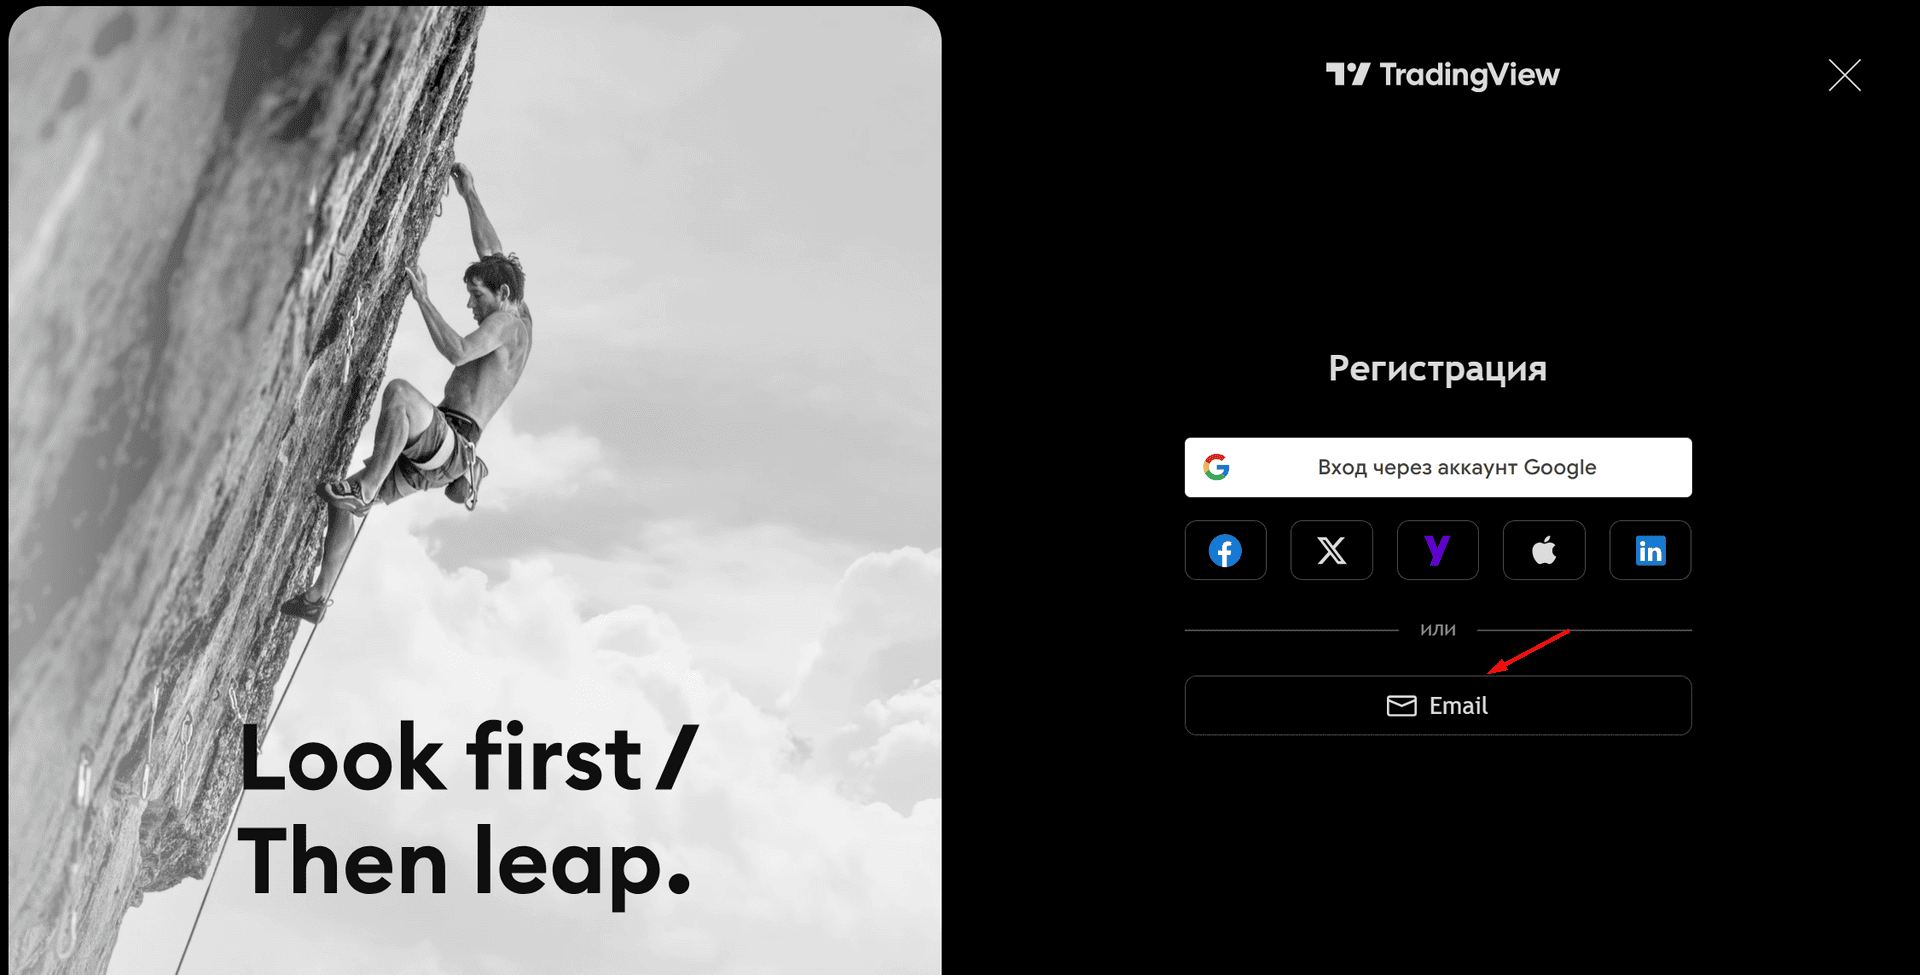
Registration takes a couple of minutes. We can create an account via email or log in via Google, Apple, Yahoo, Twitter, LinkedIn or Facebook. It is best to register the “old-fashioned” way, using email. After confirming registration by mail, we will immediately have access to the basic functionality of the platform, as well as trial access to a paid subscription for 30 days.
After creating an account, you should pay attention to setting up your profile (in the upper right corner of your personal cabinet). Here you can add an avatar, brief information about yourself, customize the visibility of your trading ideas and subscriptions, and enable two-factor authentication for account security. These steps will take a little time, but will increase the convenience and security of working on the platform.
The TradingView workspace is built around a chart. After the first authorization, you will see a blank window with the basic chart of the selected asset by default. On the left side there is a panel of drawing tools: trend lines, support and resistance levels, channels, and shapes. At the top there is a menu for selecting assets, timeframes, adding indicators and customizing charts. On the right side there is a panel with personal watch lists, alerts, chats and ideas of other traders.
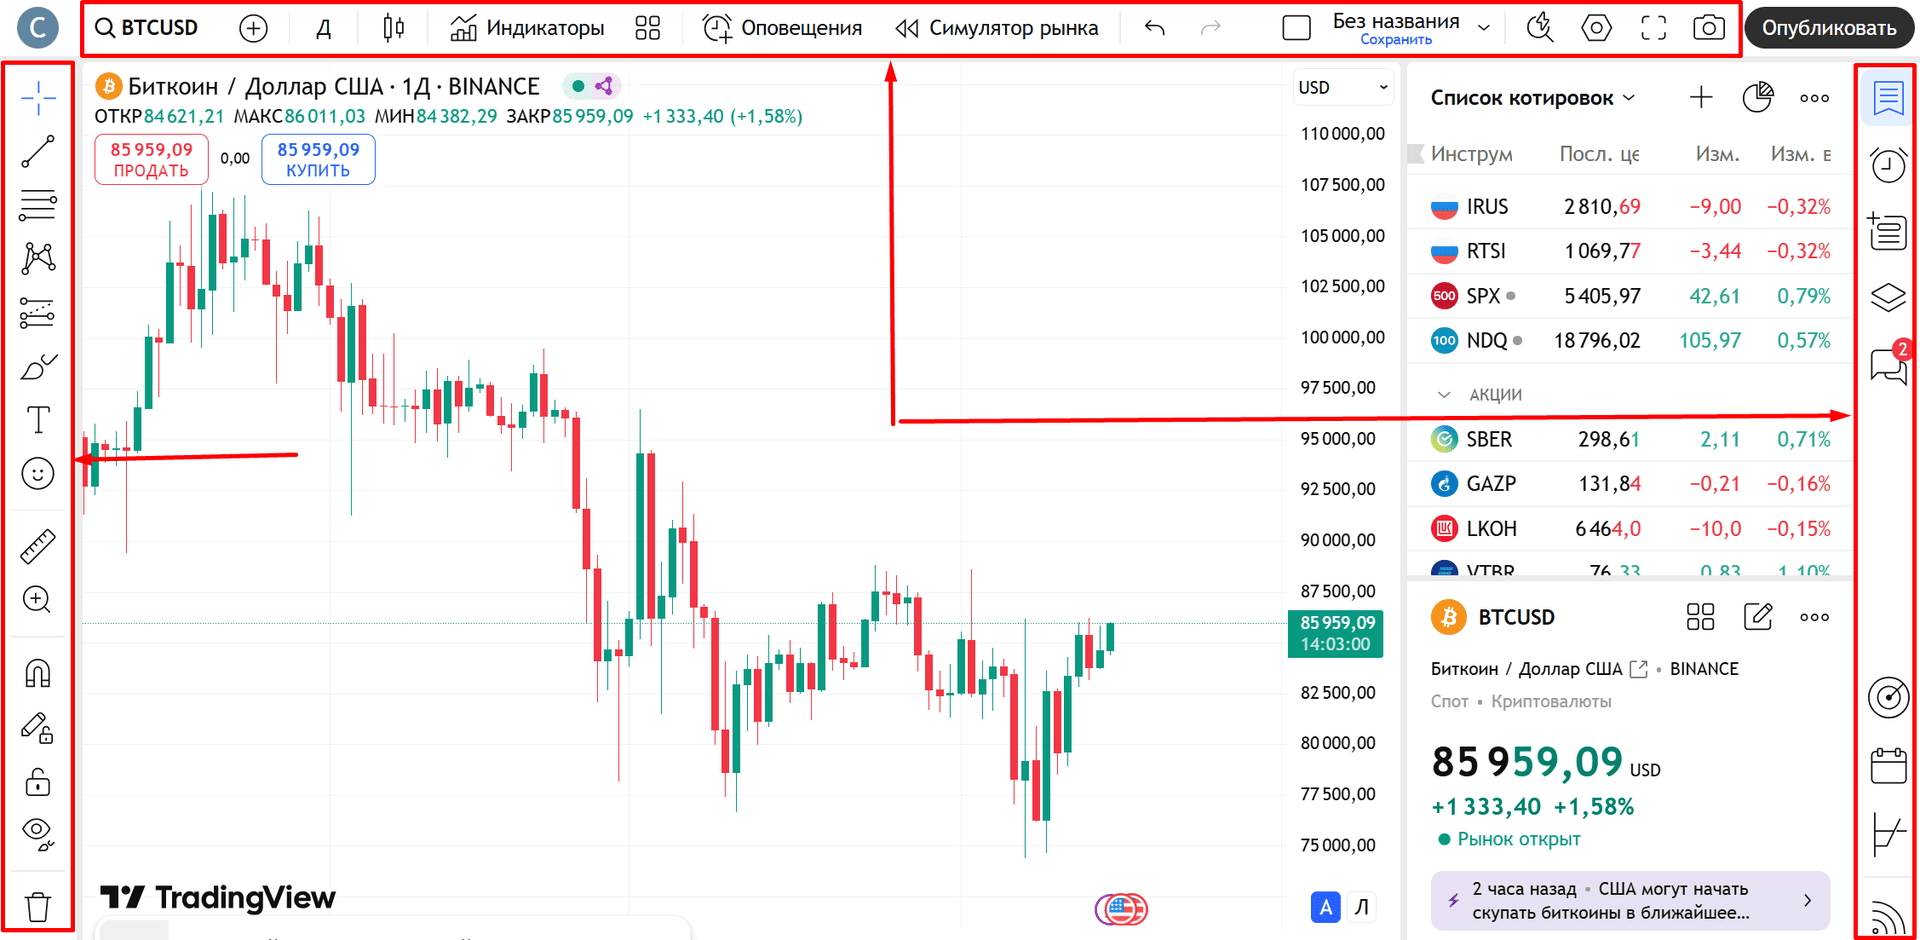
Customizing the chart starts with selecting an asset by entering the ticker symbol of the desired stock, currency pair or cryptocurrency in the search bar. Then you can change the chart type – candlesticks, bars, line, Heikin Ashi or other display style. To customize the visual perception, you can change the color scheme of candlesticks, chart background, grid, add or remove axes.
Adding indicators is done through the upper panel: just click the “Indicators” button on the upper panel and select the desired one from the built-in or popular custom ones. Each indicator can be configured separately: change calculation parameters, line color, display conditions.
You can save your workspace so that you can quickly return to your settings at any time. To do this, you can use the CTRL+S key combination, or set up auto-save and other settings by clicking on the “Arrow” in the upper toolbar. On the free version you can create one layout, on paid plans you can create several different workspaces for different strategies or markets.

Special attention should be paid to setting up alerts. They allow you to receive notifications when prices reach specified levels or when indicator conditions are met. Setting an alert takes seconds… Choose a point on the chart and right-click on it, then click “Add alert for…” (ALT+A combination). (ALT+A combination). Set the condition and notification method – pop-up window, push notification to smartphone, email or SMS (for paid users).

Additional workspace features include using hotkeys to speed up work, connecting the economic calendar to track important news and using multiple windows to analyze different assets simultaneously. The entire setup process in TradingView is designed so as not to distract the user from analyzing and making trading decisions. The interface is as flexible as possible, a beginner can easily master the basic functions, while a professional can quickly create a complex multi-layered system of charts and alerts.

TradingView has reasons for its popularity – there are many of them, and they are quite justified. But as with any tool, there are not only strong points, but also moments that may not suit a particular user.
About the benefits:
Now for the cons:
Yet, despite these limitations, the pros clearly outweigh the cons. TradingView remains one of the most balanced and convenient platforms for analyzing and working with markets, especially when comparing it with analogs in the same price range.
TradingView is not just a tool for analysis, but a full-fledged working environment that covers most of a trader’s tasks, from charting and working with indicators to writing your own strategies, blogging and opening trades directly from the platform. A user-friendly interface, support for multiple markets, flexibility of settings and a huge community make this platform one of the most versatile and understandable even for beginners.
Yes, it has limitations: the free version quickly becomes cramped, and access to real quotes of some exchanges is paid. But against the background of what you get in return, these are trifles. If trading is not just an evening hobby for you, but a real tool for earning or investing, TradingView is worth trying at least on the minimum paid tariff.
The main thing is that the platform is suitable for different types of users. Beginners will find everything here to learn in real conditions. Active traders will be able to work with any markets without switching between different services. And those who already work according to ready-made strategies will be able to automate routine and focus on decision-making.
TradingView is a platform that does not make choices for us, but gives us everything we need to make decisions consciously and professionally. And then everything depends only on us.
Write or call us. We will help you quickly re-register your accounts. Enjoy a new level of trading with cashback every month.
You are used to trusting professionals in your everyday life. Trust us with your interactions with exchanges. You won't want to go back to trading without Feebacker.com.